
 Yahoo Finance
 Shareholders in Fossil Group (NASDAQ:FOSL) are in the red if they invested a year ago
The art and science of stock market investing requires a tolerance for losing money on some of the shares you buy. But it's not unreasonable to try to avoid truly shocking capital losses. We wouldn't blame Fossil Group, Inc. (NASDAQ:FOSL) shareholders if they were still in shock after the stock dropped like a lead balloon, down 72% in just one year. That'd be enough to make even the strongest stomachs churn. We note that it has not been easy for shareholders over three years, either; the share price is down 70% in that time. Furthermore, it's down 40% in about a quarter. That's not much fun for holders. Of course, this share price action may well have been influenced by the 18% decline in the broader market, throughout the period.
With that in mind, it's worth seeing if the company's underlying fundamentals have been the driver of long term performance, or if there are some discrepancies.
Check out our latest analysis for Fossil Group
While the efficient markets hypothesis continues to be taught by some, it has been proven that markets are over-reactive dynamic systems, and investors are not always rational. One way to examine how market sentiment has changed over time is to look at the interaction between a company's share price and its earnings per share (EPS).
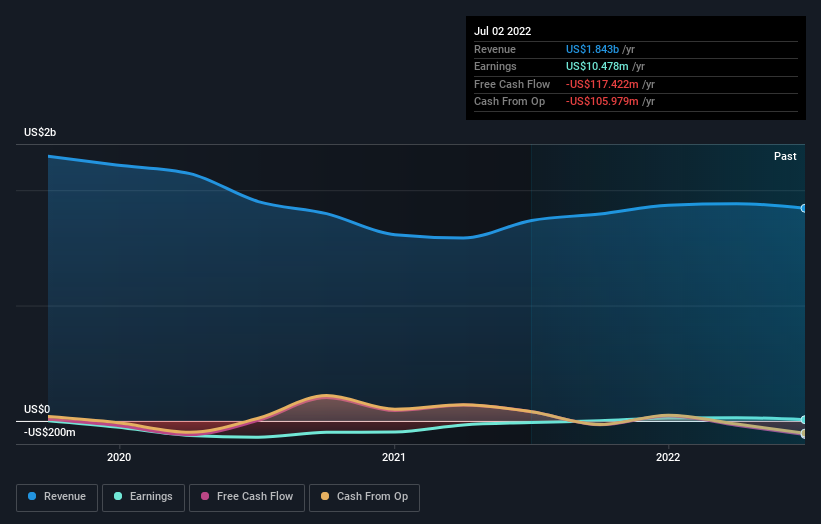
During the last year Fossil Group grew its earnings per share, moving from a loss to a profit.
When a company has just transitioned to profitability, earnings per share growth is not always the best way to look at the share price action. So it makes sense to check out some other factors.
Fossil Group managed to grow revenue over the last year, which is usually a real positive. Since we can't easily explain the share price movement based on these metrics, it might be worth considering how market sentiment has changed towards the stock.
You can see how earnings and revenue have changed over time in the image below (click on the chart to see the exact values).
This free interactive report on Fossil Group's balance sheet strength is a great place to start, if you want to investigate the stock further.
A Different Perspective
We regret to report that Fossil Group shareholders are down 72% for the year. Unfortunately, that's worse than the broader market decline of 44%. Having said that, it's inevitable that some stocks will be oversold in a falling market. The key is to keep your eyes on the fundamental developments. Regrettably, last year's performance caps off a bad run, with the shareholders facing a total loss of 10% per year over five years. We realise that Baron Rothschild has said investors should "buy when there is blood on the streets", but we caution that investors should first be sure they are buying a high quality business. While it is well worth considering the different impacts that market conditions can have on the share price, there are other factors that are even more important. To that end, you should be aware of the 1 warning sign we've spotted with Fossil Group .
But note: Fossil Group may not be the best stock to buy. So take a peek at this free list of interesting companies with past earnings growth (and further growth forecast).
Please note, the market returns quoted in this article reflect the market weighted average returns of stocks that currently trade on US exchanges.
Have feedback on this article? Concerned about the content? Get in touch with us directly. Alternatively, email editorial-team (at) simplywallst.com.
This article by Simply Wall St is general in nature. We provide commentary based on historical data and analyst forecasts only using an unbiased methodology and our articles are not intended to be financial advice. It does not constitute a recommendation to buy or sell any stock, and does not take account of your objectives, or your financial situation. We aim to bring you long-term focused analysis driven by fundamental data. Note that our analysis may not factor in the latest price-sensitive company announcements or qualitative material. Simply Wall St has no position in any stocks mentioned.
Join A Paid User Research Session
You’ll receive a US$30 Amazon Gift card for 1 hour of your time while helping us build better investing tools for the individual investors like yourself. Sign up here
