
 Yahoo Finance
 Shareholders in Genius Brands International (NASDAQ:GNUS) are in the red if they invested five years ago
Some stocks are best avoided. We really hate to see fellow investors lose their hard-earned money. Spare a thought for those who held Genius Brands International, Inc. (NASDAQ:GNUS) for five whole years - as the share price tanked 75%. Furthermore, it's down 25% in about a quarter. That's not much fun for holders.
With that in mind, it's worth seeing if the company's underlying fundamentals have been the driver of long term performance, or if there are some discrepancies.
See our latest analysis for Genius Brands International
Because Genius Brands International made a loss in the last twelve months, we think the market is probably more focussed on revenue and revenue growth, at least for now. Generally speaking, companies without profits are expected to grow revenue every year, and at a good clip. That's because fast revenue growth can be easily extrapolated to forecast profits, often of considerable size.
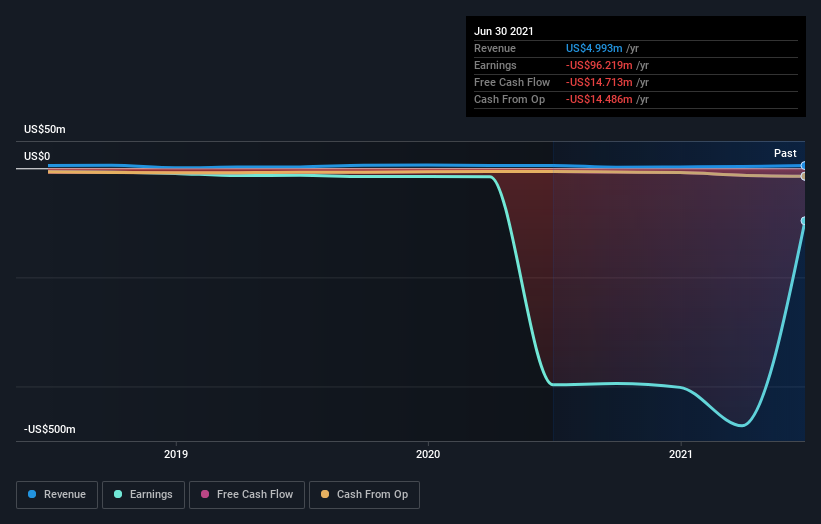
Over five years, Genius Brands International grew its revenue at 21% per year. That's better than most loss-making companies. So on the face of it we're really surprised to see the share price has averaged a fall of 12% each year, in the same time period. You'd have to assume the market is worried that profits won't come soon enough. We'd recommend carefully checking for indications of future growth - and balance sheet threats - before considering a purchase.
The graphic below depicts how earnings and revenue have changed over time (unveil the exact values by clicking on the image).
You can see how its balance sheet has strengthened (or weakened) over time in this free interactive graphic.
A Different Perspective
It's nice to see that Genius Brands International shareholders have received a total shareholder return of 47% over the last year. That certainly beats the loss of about 12% per year over the last half decade. We generally put more weight on the long term performance over the short term, but the recent improvement could hint at a (positive) inflection point within the business. I find it very interesting to look at share price over the long term as a proxy for business performance. But to truly gain insight, we need to consider other information, too. For example, we've discovered 4 warning signs for Genius Brands International (1 is a bit concerning!) that you should be aware of before investing here.
But note: Genius Brands International may not be the best stock to buy. So take a peek at this free list of interesting companies with past earnings growth (and further growth forecast).
Please note, the market returns quoted in this article reflect the market weighted average returns of stocks that currently trade on US exchanges.
This article by Simply Wall St is general in nature. We provide commentary based on historical data and analyst forecasts only using an unbiased methodology and our articles are not intended to be financial advice. It does not constitute a recommendation to buy or sell any stock, and does not take account of your objectives, or your financial situation. We aim to bring you long-term focused analysis driven by fundamental data. Note that our analysis may not factor in the latest price-sensitive company announcements or qualitative material. Simply Wall St has no position in any stocks mentioned.
Have feedback on this article? Concerned about the content? Get in touch with us directly. Alternatively, email editorial-team (at) simplywallst.com.
