
 Yahoo Finance
 Shareholders in John Wood Group (LON:WG.) have lost 78%, as stock drops 5.2% this past week
Long term investing works well, but it doesn't always work for each individual stock. It hits us in the gut when we see fellow investors suffer a loss. Imagine if you held John Wood Group PLC (LON:WG.) for half a decade as the share price tanked 80%. And we doubt long term believers are the only worried holders, since the stock price has declined 32% over the last twelve months. Unfortunately the share price momentum is still quite negative, with prices down 20% in thirty days. We really feel for shareholders in this scenario. It's a good reminder of the importance of diversification, and it's worth keeping in mind there's more to life than money, anyway.
Given the past week has been tough on shareholders, let's investigate the fundamentals and see what we can learn.
View our latest analysis for John Wood Group
While the efficient markets hypothesis continues to be taught by some, it has been proven that markets are over-reactive dynamic systems, and investors are not always rational. One flawed but reasonable way to assess how sentiment around a company has changed is to compare the earnings per share (EPS) with the share price.
We know that John Wood Group has been profitable in the past. On the other hand, it reported a trailing twelve months loss, suggesting it isn't reliably profitable. Other metrics may better explain the share price move.
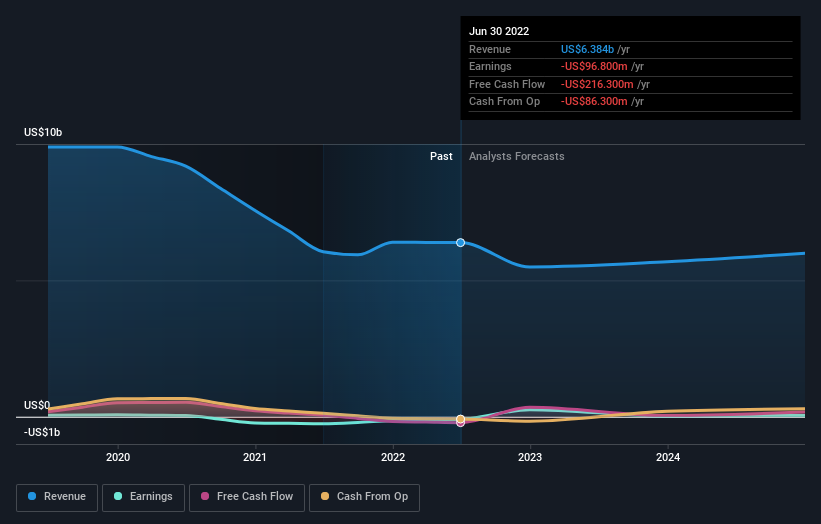
The revenue fall of 0.01% per year for five years is neither good nor terrible. But if the market expected durable top line growth, then that could explain the share price weakness.
The graphic below depicts how earnings and revenue have changed over time (unveil the exact values by clicking on the image).
Take a more thorough look at John Wood Group's financial health with this free report on its balance sheet.
What About The Total Shareholder Return (TSR)?
We'd be remiss not to mention the difference between John Wood Group's total shareholder return (TSR) and its share price return. The TSR is a return calculation that accounts for the value of cash dividends (assuming that any dividend received was reinvested) and the calculated value of any discounted capital raisings and spin-offs. Its history of dividend payouts mean that John Wood Group's TSR, which was a 78% drop over the last 5 years, was not as bad as the share price return.
A Different Perspective
While the broader market lost about 5.7% in the twelve months, John Wood Group shareholders did even worse, losing 32%. Having said that, it's inevitable that some stocks will be oversold in a falling market. The key is to keep your eyes on the fundamental developments. Unfortunately, last year's performance may indicate unresolved challenges, given that it was worse than the annualised loss of 12% over the last half decade. Generally speaking long term share price weakness can be a bad sign, though contrarian investors might want to research the stock in hope of a turnaround. I find it very interesting to look at share price over the long term as a proxy for business performance. But to truly gain insight, we need to consider other information, too. Consider for instance, the ever-present spectre of investment risk. We've identified 2 warning signs with John Wood Group (at least 1 which is potentially serious) , and understanding them should be part of your investment process.
For those who like to find winning investments this free list of growing companies with recent insider purchasing, could be just the ticket.
Please note, the market returns quoted in this article reflect the market weighted average returns of stocks that currently trade on GB exchanges.
Have feedback on this article? Concerned about the content? Get in touch with us directly. Alternatively, email editorial-team (at) simplywallst.com.
This article by Simply Wall St is general in nature. We provide commentary based on historical data and analyst forecasts only using an unbiased methodology and our articles are not intended to be financial advice. It does not constitute a recommendation to buy or sell any stock, and does not take account of your objectives, or your financial situation. We aim to bring you long-term focused analysis driven by fundamental data. Note that our analysis may not factor in the latest price-sensitive company announcements or qualitative material. Simply Wall St has no position in any stocks mentioned.
Join A Paid User Research Session
You’ll receive a US$30 Amazon Gift card for 1 hour of your time while helping us build better investing tools for the individual investors like yourself. Sign up here
