
 Yahoo Finance
 Shareholders in Johnson Service Group (LON:JSG) are in the red if they invested five years ago
For many, the main point of investing is to generate higher returns than the overall market. But even the best stock picker will only win with some selections. So we wouldn't blame long term Johnson Service Group PLC (LON:JSG) shareholders for doubting their decision to hold, with the stock down 12% over a half decade.
So let's have a look and see if the longer term performance of the company has been in line with the underlying business' progress.
See our latest analysis for Johnson Service Group
In his essay The Superinvestors of Graham-and-Doddsville Warren Buffett described how share prices do not always rationally reflect the value of a business. One imperfect but simple way to consider how the market perception of a company has shifted is to compare the change in the earnings per share (EPS) with the share price movement.
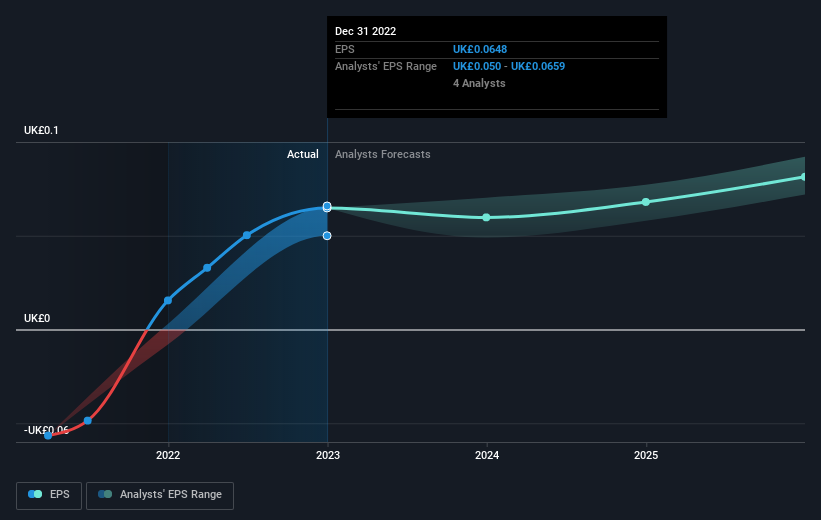
Looking back five years, both Johnson Service Group's share price and EPS declined; the latter at a rate of 0.3% per year. Readers should note that the share price has fallen faster than the EPS, at a rate of 2% per year, over the period. This implies that the market is more cautious about the business these days.
The image below shows how EPS has tracked over time (if you click on the image you can see greater detail).
It's probably worth noting that the CEO is paid less than the median at similar sized companies. But while CEO remuneration is always worth checking, the really important question is whether the company can grow earnings going forward. This free interactive report on Johnson Service Group's earnings, revenue and cash flow is a great place to start, if you want to investigate the stock further.
What About Dividends?
As well as measuring the share price return, investors should also consider the total shareholder return (TSR). Whereas the share price return only reflects the change in the share price, the TSR includes the value of dividends (assuming they were reinvested) and the benefit of any discounted capital raising or spin-off. So for companies that pay a generous dividend, the TSR is often a lot higher than the share price return. We note that for Johnson Service Group the TSR over the last 5 years was -6.9%, which is better than the share price return mentioned above. The dividends paid by the company have thusly boosted the total shareholder return.
A Different Perspective
It's good to see that Johnson Service Group has rewarded shareholders with a total shareholder return of 13% in the last twelve months. Of course, that includes the dividend. Notably the five-year annualised TSR loss of 1.3% per year compares very unfavourably with the recent share price performance. We generally put more weight on the long term performance over the short term, but the recent improvement could hint at a (positive) inflection point within the business. It's always interesting to track share price performance over the longer term. But to understand Johnson Service Group better, we need to consider many other factors. Case in point: We've spotted 1 warning sign for Johnson Service Group you should be aware of.
If you would prefer to check out another company -- one with potentially superior financials -- then do not miss this free list of companies that have proven they can grow earnings.
Please note, the market returns quoted in this article reflect the market weighted average returns of stocks that currently trade on British exchanges.
Have feedback on this article? Concerned about the content? Get in touch with us directly. Alternatively, email editorial-team (at) simplywallst.com.
This article by Simply Wall St is general in nature. We provide commentary based on historical data and analyst forecasts only using an unbiased methodology and our articles are not intended to be financial advice. It does not constitute a recommendation to buy or sell any stock, and does not take account of your objectives, or your financial situation. We aim to bring you long-term focused analysis driven by fundamental data. Note that our analysis may not factor in the latest price-sensitive company announcements or qualitative material. Simply Wall St has no position in any stocks mentioned.
Join A Paid User Research Session
You’ll receive a US$30 Amazon Gift card for 1 hour of your time while helping us build better investing tools for the individual investors like yourself. Sign up here
