
 Yahoo Finance
 Shareholders Should Look Hard At InterXion Holding N.V.’s (NYSE:INXN) 5.1%Return On Capital

Today we are going to look at InterXion Holding N.V. (NYSE:INXN) to see whether it might be an attractive investment prospect. To be precise, we'll consider its Return On Capital Employed (ROCE), as that will inform our view of the quality of the business.
First, we'll go over how we calculate ROCE. Next, we'll compare it to others in its industry. And finally, we'll look at how its current liabilities are impacting its ROCE.
Understanding Return On Capital Employed (ROCE)
ROCE is a metric for evaluating how much pre-tax income (in percentage terms) a company earns on the capital invested in its business. All else being equal, a better business will have a higher ROCE. Overall, it is a valuable metric that has its flaws. Renowned investment researcher Michael Mauboussin has suggested that a high ROCE can indicate that 'one dollar invested in the company generates value of more than one dollar'.
How Do You Calculate Return On Capital Employed?
The formula for calculating the return on capital employed is:
Return on Capital Employed = Earnings Before Interest and Tax (EBIT) ÷ (Total Assets - Current Liabilities)
Or for InterXion Holding:
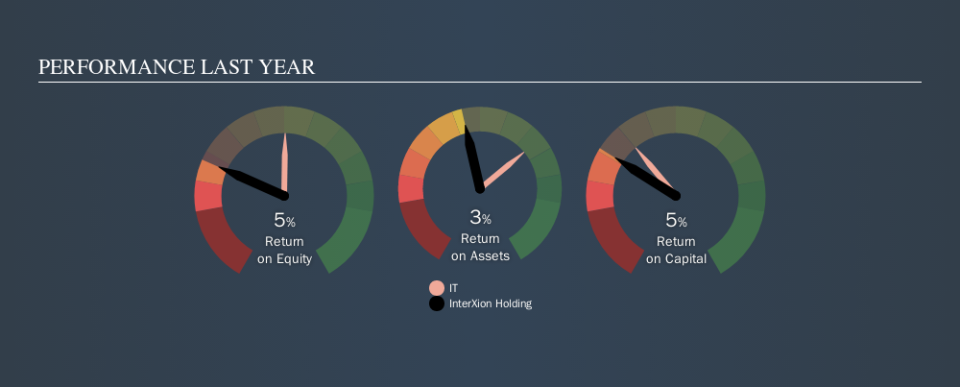
0.051 = €119m ÷ (€2.7b - €389m) (Based on the trailing twelve months to June 2019.)
Therefore, InterXion Holding has an ROCE of 5.1%.
View our latest analysis for InterXion Holding
Is InterXion Holding's ROCE Good?
When making comparisons between similar businesses, investors may find ROCE useful. We can see InterXion Holding's ROCE is meaningfully below the IT industry average of 10%. This could be seen as a negative, as it suggests some competitors may be employing their capital more efficiently. Independently of how InterXion Holding compares to its industry, its ROCE in absolute terms is low; especially compared to the ~2.7% available in government bonds. Readers may wish to look for more rewarding investments.
InterXion Holding's current ROCE of 5.1% is lower than 3 years ago, when the company reported a 7.2% ROCE. Therefore we wonder if the company is facing new headwinds. You can click on the image below to see (in greater detail) how InterXion Holding's past growth compares to other companies.
It is important to remember that ROCE shows past performance, and is not necessarily predictive. ROCE can be misleading for companies in cyclical industries, with returns looking impressive during the boom times, but very weak during the busts. ROCE is only a point-in-time measure. Future performance is what matters, and you can see analyst predictions in our free report on analyst forecasts for the company.
What Are Current Liabilities, And How Do They Affect InterXion Holding's ROCE?
Short term (or current) liabilities, are things like supplier invoices, overdrafts, or tax bills that need to be paid within 12 months. Due to the way ROCE is calculated, a high level of current liabilities makes a company look as though it has less capital employed, and thus can (sometimes unfairly) boost the ROCE. To counter this, investors can check if a company has high current liabilities relative to total assets.
InterXion Holding has total assets of €2.7b and current liabilities of €389m. As a result, its current liabilities are equal to approximately 14% of its total assets. This is not a high level of current liabilities, which would not boost the ROCE by much.
The Bottom Line On InterXion Holding's ROCE
While that is good to see, InterXion Holding has a low ROCE and does not look attractive in this analysis. Of course, you might find a fantastic investment by looking at a few good candidates. So take a peek at this free list of companies with modest (or no) debt, trading on a P/E below 20.
I will like InterXion Holding better if I see some big insider buys. While we wait, check out this free list of growing companies with considerable, recent, insider buying.
We aim to bring you long-term focused research analysis driven by fundamental data. Note that our analysis may not factor in the latest price-sensitive company announcements or qualitative material.
If you spot an error that warrants correction, please contact the editor at editorial-team@simplywallst.com. This article by Simply Wall St is general in nature. It does not constitute a recommendation to buy or sell any stock, and does not take account of your objectives, or your financial situation. Simply Wall St has no position in the stocks mentioned. Thank you for reading.
