
 Yahoo Finance
 Shareholders in Mediclinic International (LON:MDC) are in the red if they invested five years ago
Generally speaking long term investing is the way to go. But no-one is immune from buying too high. For example, after five long years the Mediclinic International plc (LON:MDC) share price is a whole 59% lower. That is extremely sub-optimal, to say the least.
With that in mind, it's worth seeing if the company's underlying fundamentals have been the driver of long term performance, or if there are some discrepancies.
View our latest analysis for Mediclinic International
To quote Buffett, 'Ships will sail around the world but the Flat Earth Society will flourish. There will continue to be wide discrepancies between price and value in the marketplace...' One flawed but reasonable way to assess how sentiment around a company has changed is to compare the earnings per share (EPS) with the share price.
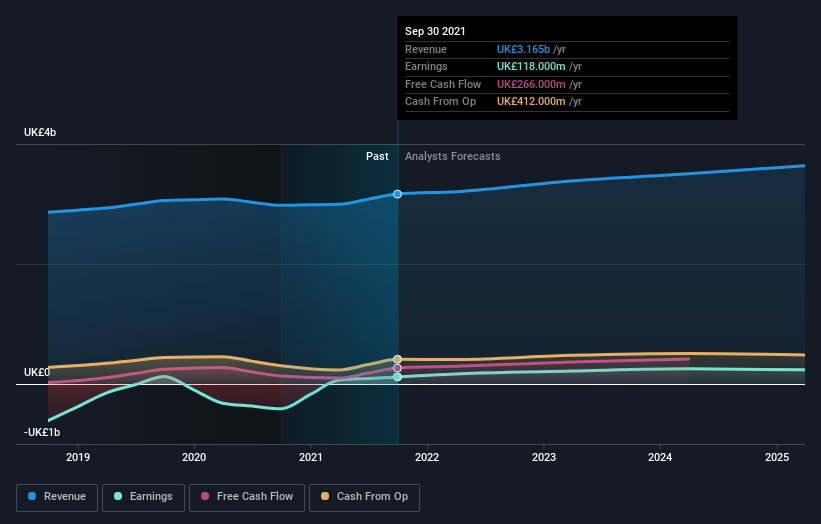
Mediclinic International became profitable within the last five years. That would generally be considered a positive, so we are surprised to see the share price is down. Other metrics might give us a better handle on how its value is changing over time.
Revenue is actually up 3.4% over the time period. A more detailed examination of the revenue and earnings may or may not explain why the share price languishes; there could be an opportunity.
You can see how earnings and revenue have changed over time in the image below (click on the chart to see the exact values).
We're pleased to report that the CEO is remunerated more modestly than most CEOs at similarly capitalized companies. It's always worth keeping an eye on CEO pay, but a more important question is whether the company will grow earnings throughout the years. You can see what analysts are predicting for Mediclinic International in this interactive graph of future profit estimates.
What about the Total Shareholder Return (TSR)?
Investors should note that there's a difference between Mediclinic International's total shareholder return (TSR) and its share price change, which we've covered above. Arguably the TSR is a more complete return calculation because it accounts for the value of dividends (as if they were reinvested), along with the hypothetical value of any discounted capital that have been offered to shareholders. Its history of dividend payouts mean that Mediclinic International's TSR, which was a 56% drop over the last 5 years, was not as bad as the share price return.
A Different Perspective
It's good to see that Mediclinic International has rewarded shareholders with a total shareholder return of 22% in the last twelve months. That certainly beats the loss of about 9% per year over the last half decade. This makes us a little wary, but the business might have turned around its fortunes. While it is well worth considering the different impacts that market conditions can have on the share price, there are other factors that are even more important. Consider risks, for instance. Every company has them, and we've spotted 1 warning sign for Mediclinic International you should know about.
Of course Mediclinic International may not be the best stock to buy. So you may wish to see this free collection of growth stocks.
Please note, the market returns quoted in this article reflect the market weighted average returns of stocks that currently trade on GB exchanges.
Have feedback on this article? Concerned about the content? Get in touch with us directly. Alternatively, email editorial-team (at) simplywallst.com.
This article by Simply Wall St is general in nature. We provide commentary based on historical data and analyst forecasts only using an unbiased methodology and our articles are not intended to be financial advice. It does not constitute a recommendation to buy or sell any stock, and does not take account of your objectives, or your financial situation. We aim to bring you long-term focused analysis driven by fundamental data. Note that our analysis may not factor in the latest price-sensitive company announcements or qualitative material. Simply Wall St has no position in any stocks mentioned.
