
 Yahoo Finance
 Shareholders in Middleby (NASDAQ:MIDD) are in the red if they invested three years ago
Many investors define successful investing as beating the market average over the long term. But in any portfolio, there are likely to be some stocks that fall short of that benchmark. We regret to report that long term The Middleby Corporation (NASDAQ:MIDD) shareholders have had that experience, with the share price dropping 21% in three years, versus a market return of about 12%.
With that in mind, it's worth seeing if the company's underlying fundamentals have been the driver of long term performance, or if there are some discrepancies.
View our latest analysis for Middleby
To quote Buffett, 'Ships will sail around the world but the Flat Earth Society will flourish. There will continue to be wide discrepancies between price and value in the marketplace...' By comparing earnings per share (EPS) and share price changes over time, we can get a feel for how investor attitudes to a company have morphed over time.
Although the share price is down over three years, Middleby actually managed to grow EPS by 26% per year in that time. Given the share price reaction, one might suspect that EPS is not a good guide to the business performance during the period (perhaps due to a one-off loss or gain). Or else the company was over-hyped in the past, and so its growth has disappointed.
Since the change in EPS doesn't seem to correlate with the change in share price, it's worth taking a look at other metrics.
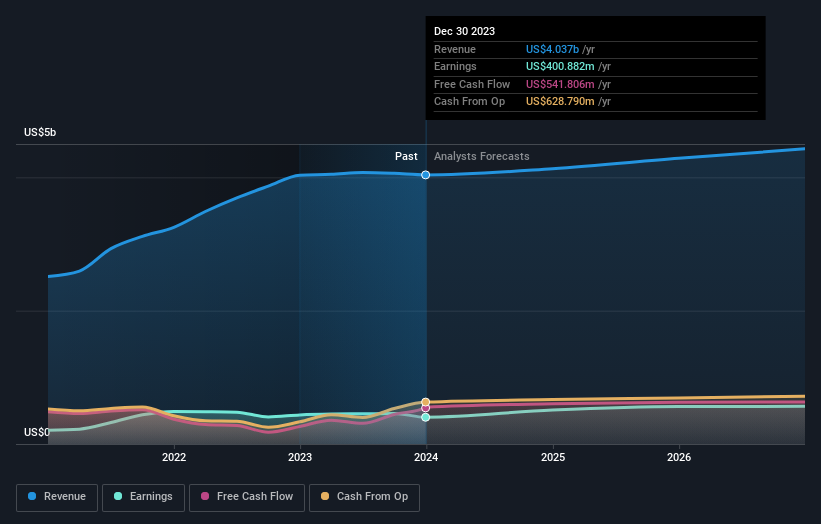
We note that, in three years, revenue has actually grown at a 16% annual rate, so that doesn't seem to be a reason to sell shares. It's probably worth investigating Middleby further; while we may be missing something on this analysis, there might also be an opportunity.
The company's revenue and earnings (over time) are depicted in the image below (click to see the exact numbers).
We consider it positive that insiders have made significant purchases in the last year. Having said that, most people consider earnings and revenue growth trends to be a more meaningful guide to the business. This free report showing analyst forecasts should help you form a view on Middleby
A Different Perspective
Middleby shareholders are up 1.1% for the year. Unfortunately this falls short of the market return. It's probably a good sign that the company has an even better long term track record, having provided shareholders with an annual TSR of 1.3% over five years. It may well be that this is a business worth popping on the watching, given the continuing positive reception, over time, from the market. It's always interesting to track share price performance over the longer term. But to understand Middleby better, we need to consider many other factors. Consider risks, for instance. Every company has them, and we've spotted 1 warning sign for Middleby you should know about.
If you like to buy stocks alongside management, then you might just love this free list of companies. (Hint: insiders have been buying them).
Please note, the market returns quoted in this article reflect the market weighted average returns of stocks that currently trade on American exchanges.
Have feedback on this article? Concerned about the content? Get in touch with us directly. Alternatively, email editorial-team (at) simplywallst.com.
This article by Simply Wall St is general in nature. We provide commentary based on historical data and analyst forecasts only using an unbiased methodology and our articles are not intended to be financial advice. It does not constitute a recommendation to buy or sell any stock, and does not take account of your objectives, or your financial situation. We aim to bring you long-term focused analysis driven by fundamental data. Note that our analysis may not factor in the latest price-sensitive company announcements or qualitative material. Simply Wall St has no position in any stocks mentioned.
