
 Yahoo Finance
 Shareholders in NORMA Group (ETR:NOEJ) are in the red if they invested five years ago
NORMA Group SE (ETR:NOEJ) shareholders should be happy to see the share price up 11% in the last month. But that doesn't change the fact that the returns over the last half decade have been disappointing. In fact, the share price has declined rather badly, down some 65% in that time. Some might say the recent bounce is to be expected after such a bad drop. Of course, this could be the start of a turnaround.
Now let's have a look at the company's fundamentals, and see if the long term shareholder return has matched the performance of the underlying business.
See our latest analysis for NORMA Group
While the efficient markets hypothesis continues to be taught by some, it has been proven that markets are over-reactive dynamic systems, and investors are not always rational. One imperfect but simple way to consider how the market perception of a company has shifted is to compare the change in the earnings per share (EPS) with the share price movement.
During the five years over which the share price declined, NORMA Group's earnings per share (EPS) dropped by 25% each year. The share price decline of 19% per year isn't as bad as the EPS decline. So investors might expect EPS to bounce back -- or they may have previously foreseen the EPS decline.
The graphic below depicts how EPS has changed over time (unveil the exact values by clicking on the image).
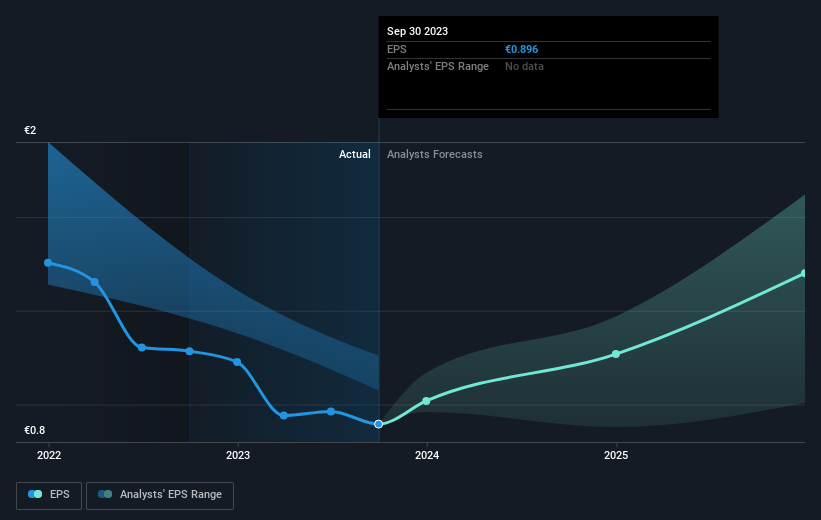
We know that NORMA Group has improved its bottom line over the last three years, but what does the future have in store? It might be well worthwhile taking a look at our free report on how its financial position has changed over time.
What About Dividends?
It is important to consider the total shareholder return, as well as the share price return, for any given stock. The TSR is a return calculation that accounts for the value of cash dividends (assuming that any dividend received was reinvested) and the calculated value of any discounted capital raisings and spin-offs. Arguably, the TSR gives a more comprehensive picture of the return generated by a stock. We note that for NORMA Group the TSR over the last 5 years was -61%, which is better than the share price return mentioned above. The dividends paid by the company have thusly boosted the total shareholder return.
A Different Perspective
While the broader market gained around 11% in the last year, NORMA Group shareholders lost 35% (even including dividends). However, keep in mind that even the best stocks will sometimes underperform the market over a twelve month period. Regrettably, last year's performance caps off a bad run, with the shareholders facing a total loss of 10% per year over five years. We realise that Baron Rothschild has said investors should "buy when there is blood on the streets", but we caution that investors should first be sure they are buying a high quality business. It's always interesting to track share price performance over the longer term. But to understand NORMA Group better, we need to consider many other factors. To that end, you should be aware of the 3 warning signs we've spotted with NORMA Group .
But note: NORMA Group may not be the best stock to buy. So take a peek at this free list of interesting companies with past earnings growth (and further growth forecast).
Please note, the market returns quoted in this article reflect the market weighted average returns of stocks that currently trade on German exchanges.
Have feedback on this article? Concerned about the content? Get in touch with us directly. Alternatively, email editorial-team (at) simplywallst.com.
This article by Simply Wall St is general in nature. We provide commentary based on historical data and analyst forecasts only using an unbiased methodology and our articles are not intended to be financial advice. It does not constitute a recommendation to buy or sell any stock, and does not take account of your objectives, or your financial situation. We aim to bring you long-term focused analysis driven by fundamental data. Note that our analysis may not factor in the latest price-sensitive company announcements or qualitative material. Simply Wall St has no position in any stocks mentioned.
