
 Yahoo Finance
 Shareholders Are Optimistic That Gamma Communications (LON:GAMA) Will Multiply In Value
What are the early trends we should look for to identify a stock that could multiply in value over the long term? Amongst other things, we'll want to see two things; firstly, a growing return on capital employed (ROCE) and secondly, an expansion in the company's amount of capital employed. Ultimately, this demonstrates that it's a business that is reinvesting profits at increasing rates of return. Ergo, when we looked at the ROCE trends at Gamma Communications (LON:GAMA), we liked what we saw.
Understanding Return On Capital Employed (ROCE)
If you haven't worked with ROCE before, it measures the 'return' (pre-tax profit) a company generates from capital employed in its business. To calculate this metric for Gamma Communications, this is the formula:
Return on Capital Employed = Earnings Before Interest and Tax (EBIT) ÷ (Total Assets - Current Liabilities)
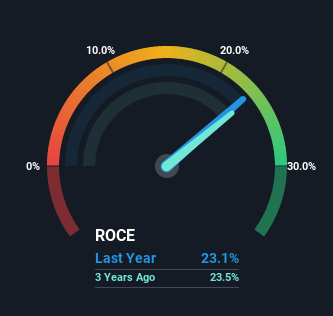
0.23 = UK£68m ÷ (UK£362m - UK£66m) (Based on the trailing twelve months to December 2021).
Thus, Gamma Communications has an ROCE of 23%. In absolute terms that's a great return and it's even better than the Telecom industry average of 11%.
Check out our latest analysis for Gamma Communications
In the above chart we have measured Gamma Communications' prior ROCE against its prior performance, but the future is arguably more important. If you'd like to see what analysts are forecasting going forward, you should check out our free report for Gamma Communications.
The Trend Of ROCE
In terms of Gamma Communications' history of ROCE, it's quite impressive. The company has employed 259% more capital in the last five years, and the returns on that capital have remained stable at 23%. With returns that high, it's great that the business can continually reinvest its money at such appealing rates of return. You'll see this when looking at well operated businesses or favorable business models.
One more thing to note, even though ROCE has remained relatively flat over the last five years, the reduction in current liabilities to 18% of total assets, is good to see from a business owner's perspective. This can eliminate some of the risks inherent in the operations because the business has less outstanding obligations to their suppliers and or short-term creditors than they did previously.
The Bottom Line On Gamma Communications' ROCE
In the end, the company has proven it can reinvest it's capital at high rates of returns, which you'll remember is a trait of a multi-bagger. And the stock has followed suit returning a meaningful 90% to shareholders over the last five years. So even though the stock might be more "expensive" than it was before, we think the strong fundamentals warrant this stock for further research.
Gamma Communications does have some risks though, and we've spotted 1 warning sign for Gamma Communications that you might be interested in.
High returns are a key ingredient to strong performance, so check out our free list ofstocks earning high returns on equity with solid balance sheets.
Have feedback on this article? Concerned about the content? Get in touch with us directly. Alternatively, email editorial-team (at) simplywallst.com.
This article by Simply Wall St is general in nature. We provide commentary based on historical data and analyst forecasts only using an unbiased methodology and our articles are not intended to be financial advice. It does not constitute a recommendation to buy or sell any stock, and does not take account of your objectives, or your financial situation. We aim to bring you long-term focused analysis driven by fundamental data. Note that our analysis may not factor in the latest price-sensitive company announcements or qualitative material. Simply Wall St has no position in any stocks mentioned.
