
 Yahoo Finance
 Shareholders in PRA Group (NASDAQ:PRAA) have lost 42%, as stock drops 16% this past week
As an investor its worth striving to ensure your overall portfolio beats the market average. But if you try your hand at stock picking, you risk returning less than the market. We regret to report that long term PRA Group, Inc. (NASDAQ:PRAA) shareholders have had that experience, with the share price dropping 42% in three years, versus a market return of about 21%. And the share price decline continued over the last week, dropping some 16%.
With the stock having lost 16% in the past week, it's worth taking a look at business performance and seeing if there's any red flags.
See our latest analysis for PRA Group
There is no denying that markets are sometimes efficient, but prices do not always reflect underlying business performance. One way to examine how market sentiment has changed over time is to look at the interaction between a company's share price and its earnings per share (EPS).
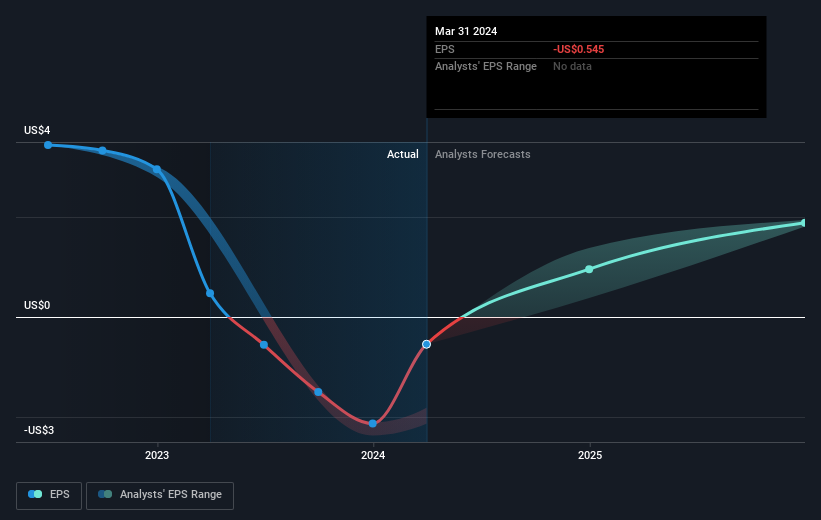
Over the three years that the share price declined, PRA Group's earnings per share (EPS) dropped significantly, falling to a loss. Extraordinary items contributed to this situation. Due to the loss, it's not easy to use EPS as a reliable guide to the business. However, we can say we'd expect to see a falling share price in this scenario.
The graphic below depicts how EPS has changed over time (unveil the exact values by clicking on the image).
We like that insiders have been buying shares in the last twelve months. Having said that, most people consider earnings and revenue growth trends to be a more meaningful guide to the business. Dive deeper into the earnings by checking this interactive graph of PRA Group's earnings, revenue and cash flow.
A Different Perspective
PRA Group shareholders gained a total return of 18% during the year. Unfortunately this falls short of the market return. On the bright side, that's still a gain, and it is certainly better than the yearly loss of about 4% endured over half a decade. So this might be a sign the business has turned its fortunes around. While it is well worth considering the different impacts that market conditions can have on the share price, there are other factors that are even more important. Consider risks, for instance. Every company has them, and we've spotted 1 warning sign for PRA Group you should know about.
PRA Group is not the only stock insiders are buying. So take a peek at this free list of small cap companies at attractive valuations which insiders have been buying.
Please note, the market returns quoted in this article reflect the market weighted average returns of stocks that currently trade on American exchanges.
Have feedback on this article? Concerned about the content? Get in touch with us directly. Alternatively, email editorial-team (at) simplywallst.com.
This article by Simply Wall St is general in nature. We provide commentary based on historical data and analyst forecasts only using an unbiased methodology and our articles are not intended to be financial advice. It does not constitute a recommendation to buy or sell any stock, and does not take account of your objectives, or your financial situation. We aim to bring you long-term focused analysis driven by fundamental data. Note that our analysis may not factor in the latest price-sensitive company announcements or qualitative material. Simply Wall St has no position in any stocks mentioned.
