
 Yahoo Finance
 Would Shareholders Who Purchased Scentre Group's (ASX:SCG) Stock Five Years Be Happy With The Share price Today?
Ideally, your overall portfolio should beat the market average. But in any portfolio, there will be mixed results between individual stocks. So we wouldn't blame long term Scentre Group (ASX:SCG) shareholders for doubting their decision to hold, with the stock down 38% over a half decade.
See our latest analysis for Scentre Group
While markets are a powerful pricing mechanism, share prices reflect investor sentiment, not just underlying business performance. One imperfect but simple way to consider how the market perception of a company has shifted is to compare the change in the earnings per share (EPS) with the share price movement.
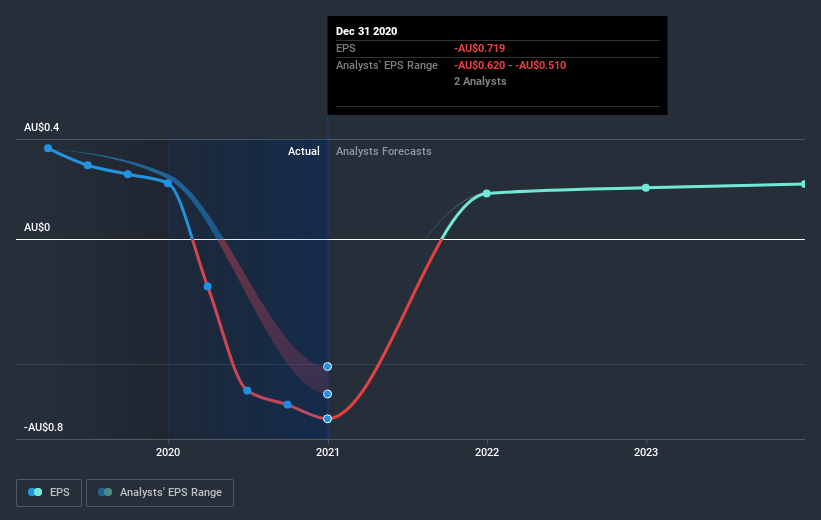
Over five years Scentre Group's earnings per share dropped significantly, falling to a loss, with the share price also lower. The recent extraordinary items contributed to this situation. At present it's hard to make valid comparisons between EPS and the share price. However, we can say we'd expect to see a falling share price in this scenario.
You can see below how EPS has changed over time (discover the exact values by clicking on the image).
It's probably worth noting we've seen significant insider buying in the last quarter, which we consider a positive. That said, we think earnings and revenue growth trends are even more important factors to consider. Dive deeper into the earnings by checking this interactive graph of Scentre Group's earnings, revenue and cash flow.
What About Dividends?
As well as measuring the share price return, investors should also consider the total shareholder return (TSR). The TSR incorporates the value of any spin-offs or discounted capital raisings, along with any dividends, based on the assumption that the dividends are reinvested. It's fair to say that the TSR gives a more complete picture for stocks that pay a dividend. We note that for Scentre Group the TSR over the last 5 years was -22%, which is better than the share price return mentioned above. The dividends paid by the company have thusly boosted the total shareholder return.
A Different Perspective
Scentre Group's TSR for the year was broadly in line with the market average, at 40%. To take a positive view, the gain is pleasing, and it sure beats annualized TSR loss of 4%, which was endured over half a decade. While 'turnarounds seldom turn' there are green shoots for Scentre Group. While it is well worth considering the different impacts that market conditions can have on the share price, there are other factors that are even more important. Even so, be aware that Scentre Group is showing 3 warning signs in our investment analysis , and 1 of those is significant...
If you like to buy stocks alongside management, then you might just love this free list of companies. (Hint: insiders have been buying them).
Please note, the market returns quoted in this article reflect the market weighted average returns of stocks that currently trade on AU exchanges.
This article by Simply Wall St is general in nature. It does not constitute a recommendation to buy or sell any stock, and does not take account of your objectives, or your financial situation. We aim to bring you long-term focused analysis driven by fundamental data. Note that our analysis may not factor in the latest price-sensitive company announcements or qualitative material. Simply Wall St has no position in any stocks mentioned.
Have feedback on this article? Concerned about the content? Get in touch with us directly. Alternatively, email editorial-team (at) simplywallst.com.
