
 Yahoo Finance
 Shareholders Of XP Power (LON:XPP) Must Be Happy With Their 139% Total Return
It hasn't been the best quarter for XP Power Limited (LON:XPP) shareholders, since the share price has fallen 20% in that time. But that scarcely detracts from the really solid long term returns generated by the company over five years. We think most investors would be happy with the 103% return, over that period. We think it's more important to dwell on the long term returns than the short term returns. Only time will tell if there is still too much optimism currently reflected in the share price.
Check out our latest analysis for XP Power
In his essay The Superinvestors of Graham-and-Doddsville Warren Buffett described how share prices do not always rationally reflect the value of a business. By comparing earnings per share (EPS) and share price changes over time, we can get a feel for how investor attitudes to a company have morphed over time.
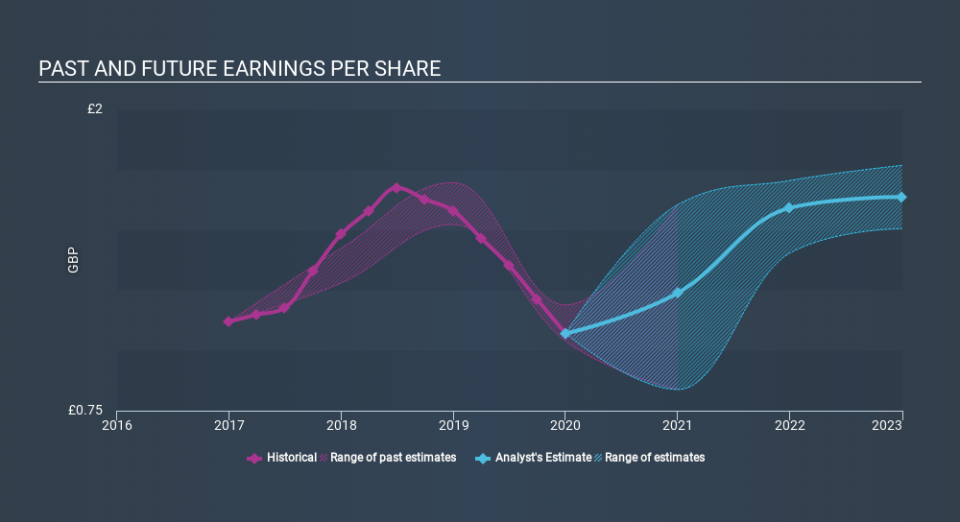
During five years of share price growth, XP Power achieved compound earnings per share (EPS) growth of 0.9% per year. This EPS growth is lower than the 15% average annual increase in the share price. This suggests that market participants hold the company in higher regard, these days. That's not necessarily surprising considering the five-year track record of earnings growth.
You can see how EPS has changed over time in the image below (click on the chart to see the exact values).
We're pleased to report that the CEO is remunerated more modestly than most CEOs at similarly capitalized companies. But while CEO remuneration is always worth checking, the really important question is whether the company can grow earnings going forward. It might be well worthwhile taking a look at our free report on XP Power's earnings, revenue and cash flow.
What about the Total Shareholder Return (TSR)?
We'd be remiss not to mention the difference between XP Power's total shareholder return (TSR) and its share price return. The TSR is a return calculation that accounts for the value of cash dividends (assuming that any dividend received was reinvested) and the calculated value of any discounted capital raisings and spin-offs. XP Power's TSR of 139% for the 5 years exceeded its share price return, because it has paid dividends.
A Different Perspective
It's good to see that XP Power has rewarded shareholders with a total shareholder return of 21% in the last twelve months. Since the one-year TSR is better than the five-year TSR (the latter coming in at 19% per year), it would seem that the stock's performance has improved in recent times. Someone with an optimistic perspective could view the recent improvement in TSR as indicating that the business itself is getting better with time. I find it very interesting to look at share price over the long term as a proxy for business performance. But to truly gain insight, we need to consider other information, too. Case in point: We've spotted 2 warning signs for XP Power you should be aware of.
Of course, you might find a fantastic investment by looking elsewhere. So take a peek at this free list of companies we expect will grow earnings.
Please note, the market returns quoted in this article reflect the market weighted average returns of stocks that currently trade on GB exchanges.
If you spot an error that warrants correction, please contact the editor at editorial-team@simplywallst.com. This article by Simply Wall St is general in nature. It does not constitute a recommendation to buy or sell any stock, and does not take account of your objectives, or your financial situation. Simply Wall St has no position in the stocks mentioned.
We aim to bring you long-term focused research analysis driven by fundamental data. Note that our analysis may not factor in the latest price-sensitive company announcements or qualitative material. Thank you for reading.
