
 Yahoo Finance
 We Like Sherwin-Williams' (NYSE:SHW) Returns And Here's How They're Trending
If we want to find a potential multi-bagger, often there are underlying trends that can provide clues. In a perfect world, we'd like to see a company investing more capital into its business and ideally the returns earned from that capital are also increasing. Ultimately, this demonstrates that it's a business that is reinvesting profits at increasing rates of return. So when we looked at the ROCE trend of Sherwin-Williams (NYSE:SHW) we really liked what we saw.
What Is Return On Capital Employed (ROCE)?
For those that aren't sure what ROCE is, it measures the amount of pre-tax profits a company can generate from the capital employed in its business. To calculate this metric for Sherwin-Williams, this is the formula:
Return on Capital Employed = Earnings Before Interest and Tax (EBIT) ÷ (Total Assets - Current Liabilities)
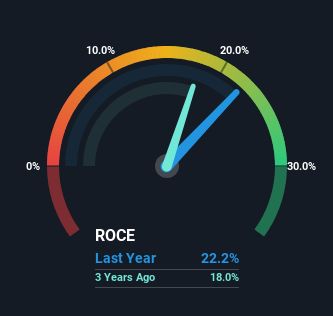
0.22 = US$3.6b ÷ (US$23b - US$6.6b) (Based on the trailing twelve months to December 2023).
Therefore, Sherwin-Williams has an ROCE of 22%. That's a fantastic return and not only that, it outpaces the average of 9.7% earned by companies in a similar industry.
Check out our latest analysis for Sherwin-Williams
Above you can see how the current ROCE for Sherwin-Williams compares to its prior returns on capital, but there's only so much you can tell from the past. If you're interested, you can view the analysts predictions in our free analyst report for Sherwin-Williams .
How Are Returns Trending?
Sherwin-Williams has not disappointed with their ROCE growth. Looking at the data, we can see that even though capital employed in the business has remained relatively flat, the ROCE generated has risen by 76% over the last five years. So it's likely that the business is now reaping the full benefits of its past investments, since the capital employed hasn't changed considerably. The company is doing well in that sense, and it's worth investigating what the management team has planned for long term growth prospects.
What We Can Learn From Sherwin-Williams' ROCE
To sum it up, Sherwin-Williams is collecting higher returns from the same amount of capital, and that's impressive. Since the stock has returned a staggering 121% to shareholders over the last five years, it looks like investors are recognizing these changes. So given the stock has proven it has promising trends, it's worth researching the company further to see if these trends are likely to persist.
If you'd like to know about the risks facing Sherwin-Williams, we've discovered 1 warning sign that you should be aware of.
If you want to search for more stocks that have been earning high returns, check out this free list of stocks with solid balance sheets that are also earning high returns on equity.
Have feedback on this article? Concerned about the content? Get in touch with us directly. Alternatively, email editorial-team (at) simplywallst.com.
This article by Simply Wall St is general in nature. We provide commentary based on historical data and analyst forecasts only using an unbiased methodology and our articles are not intended to be financial advice. It does not constitute a recommendation to buy or sell any stock, and does not take account of your objectives, or your financial situation. We aim to bring you long-term focused analysis driven by fundamental data. Note that our analysis may not factor in the latest price-sensitive company announcements or qualitative material. Simply Wall St has no position in any stocks mentioned.
