
 Yahoo Finance
 Shoals Technologies Group (NASDAQ:SHLS) Has Some Way To Go To Become A Multi-Bagger
Finding a business that has the potential to grow substantially is not easy, but it is possible if we look at a few key financial metrics. In a perfect world, we'd like to see a company investing more capital into its business and ideally the returns earned from that capital are also increasing. Ultimately, this demonstrates that it's a business that is reinvesting profits at increasing rates of return. That's why when we briefly looked at Shoals Technologies Group's (NASDAQ:SHLS) ROCE trend, we were pretty happy with what we saw.
Understanding Return On Capital Employed (ROCE)
Just to clarify if you're unsure, ROCE is a metric for evaluating how much pre-tax income (in percentage terms) a company earns on the capital invested in its business. The formula for this calculation on Shoals Technologies Group is:
Return on Capital Employed = Earnings Before Interest and Tax (EBIT) ÷ (Total Assets - Current Liabilities)
0.13 = US$44m ÷ (US$383m - US$36m) (Based on the trailing twelve months to September 2021).
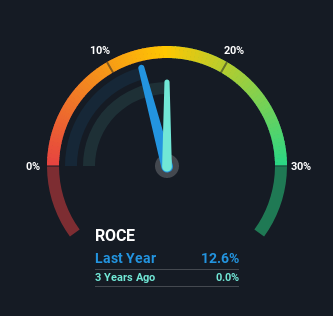
So, Shoals Technologies Group has an ROCE of 13%. On its own, that's a standard return, however it's much better than the 9.3% generated by the Electrical industry.
View our latest analysis for Shoals Technologies Group
Above you can see how the current ROCE for Shoals Technologies Group compares to its prior returns on capital, but there's only so much you can tell from the past. If you'd like to see what analysts are forecasting going forward, you should check out our free report for Shoals Technologies Group.
What Can We Tell From Shoals Technologies Group's ROCE Trend?
The trend of ROCE doesn't stand out much, but returns on a whole are decent. Over the past two years, ROCE has remained relatively flat at around 13% and the business has deployed 109% more capital into its operations. Since 13% is a moderate ROCE though, it's good to see a business can continue to reinvest at these decent rates of return. Stable returns in this ballpark can be unexciting, but if they can be maintained over the long run, they often provide nice rewards to shareholders.
Our Take On Shoals Technologies Group's ROCE
To sum it up, Shoals Technologies Group has simply been reinvesting capital steadily, at those decent rates of return. However, despite the favorable fundamentals, the stock has fallen 54% over the last year, so there might be an opportunity here for astute investors. That's why we think it'd be worthwhile to look further into this stock given the fundamentals are appealing.
Since virtually every company faces some risks, it's worth knowing what they are, and we've spotted 6 warning signs for Shoals Technologies Group (of which 2 are potentially serious!) that you should know about.
If you want to search for solid companies with great earnings, check out this free list of companies with good balance sheets and impressive returns on equity.
Have feedback on this article? Concerned about the content? Get in touch with us directly. Alternatively, email editorial-team (at) simplywallst.com.
This article by Simply Wall St is general in nature. We provide commentary based on historical data and analyst forecasts only using an unbiased methodology and our articles are not intended to be financial advice. It does not constitute a recommendation to buy or sell any stock, and does not take account of your objectives, or your financial situation. We aim to bring you long-term focused analysis driven by fundamental data. Note that our analysis may not factor in the latest price-sensitive company announcements or qualitative material. Simply Wall St has no position in any stocks mentioned.
