
 Yahoo Finance
 Short Intel Corporation (INTC) Stock Into the Semiconductor Slide
InvestorPlace - Stock Market News, Stock Advice & Trading Tips
Semiconductor stocks have been getting slippery of late. And nowhere has the weakness been more apparent than with Intel Corporation (NASDAQ:INTC). Not that underperformance is anything new for INTC stock.

The chip giant lost its mojo many months ago, forsaken by investors in search of “growthier” stocks like Nvidia Corporation (NASDAQ:NVDA), Micron Technology, Inc. (NASDAQ:MU) and Advanced Micro Devices (NASDAQ:AMD). But now, Intel stock is threatening to break below key support levels, and its demise could weigh on the entire semiconductor space.
To begin, let’s first consider the recent behavior of the VanEck Vectors Semiconductor ETF (NYSEARCA:SMH).
SMH is the most liquid of the exchange traded funds available that track the semiconductor industry. It’s top four holdings include Taiwan Semiconductor Mfg. Co. Ltd. (ADR) (NYSE:TSM), Intel, Qualcomm, Inc. (NASDAQ:QCOM) and Nvidia. This quartet comprises more than one-third of the fund.
The SMH ETF is undoubtedly the poster child for the most recent stage of our bull market. It’s ascent has fueled the Nasdaq’s dominance this year. But ever since the June 9 tech-stock swoon, SMH has been a mess. And Tuesday’s trading session should have the bulls worried for a couple of reasons.
First up is the formation of yet another lower pivot high.
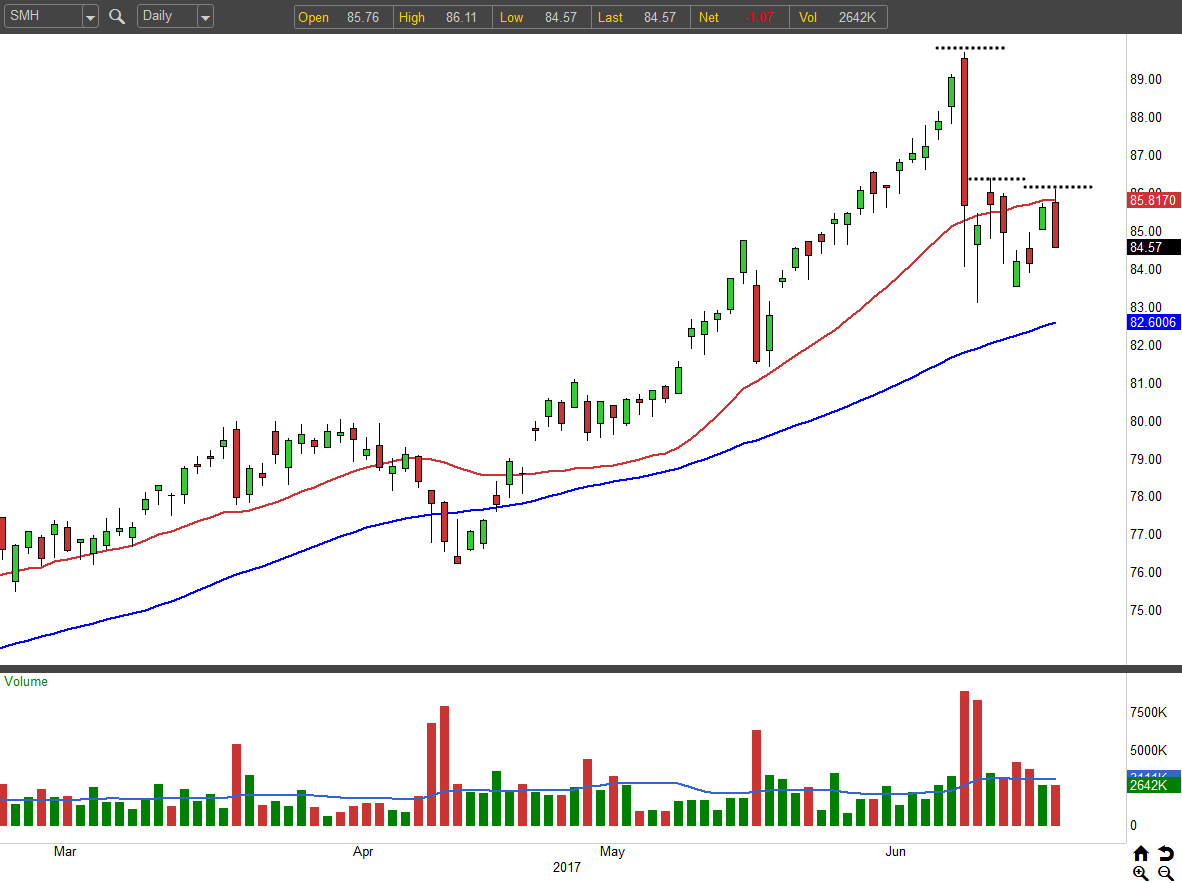
Source: OptionsAnalytix
This strains the obvious, but lower peaks are not a characteristic of uptrends. Quite the contrary, descending pivot highs reveal increased selling aggression. SMH has now failed to climb back above its 20-day moving average twice. Tuesday’s rejection delivered a nasty-looking bearish reversal candle, which suggests the path of least resistance is now lower. Bulls need to see a break back above $86.25 to invalidate the deterioration.
Volume patterns have also turned decisively bearish ever since the June 9th sucker punch. Distribution days are becoming commonplace which is always a sign for caution.
Intel’s Charts
INTC stock has been locked in a symmetrical triangle for the past six months. Nothing screams stalemate like this neutral pattern.
Normally, I quickly pass on trading stocks that can’t make up their mind and start trending, but with Intel potentially breaking its support line, things are getting interesting.
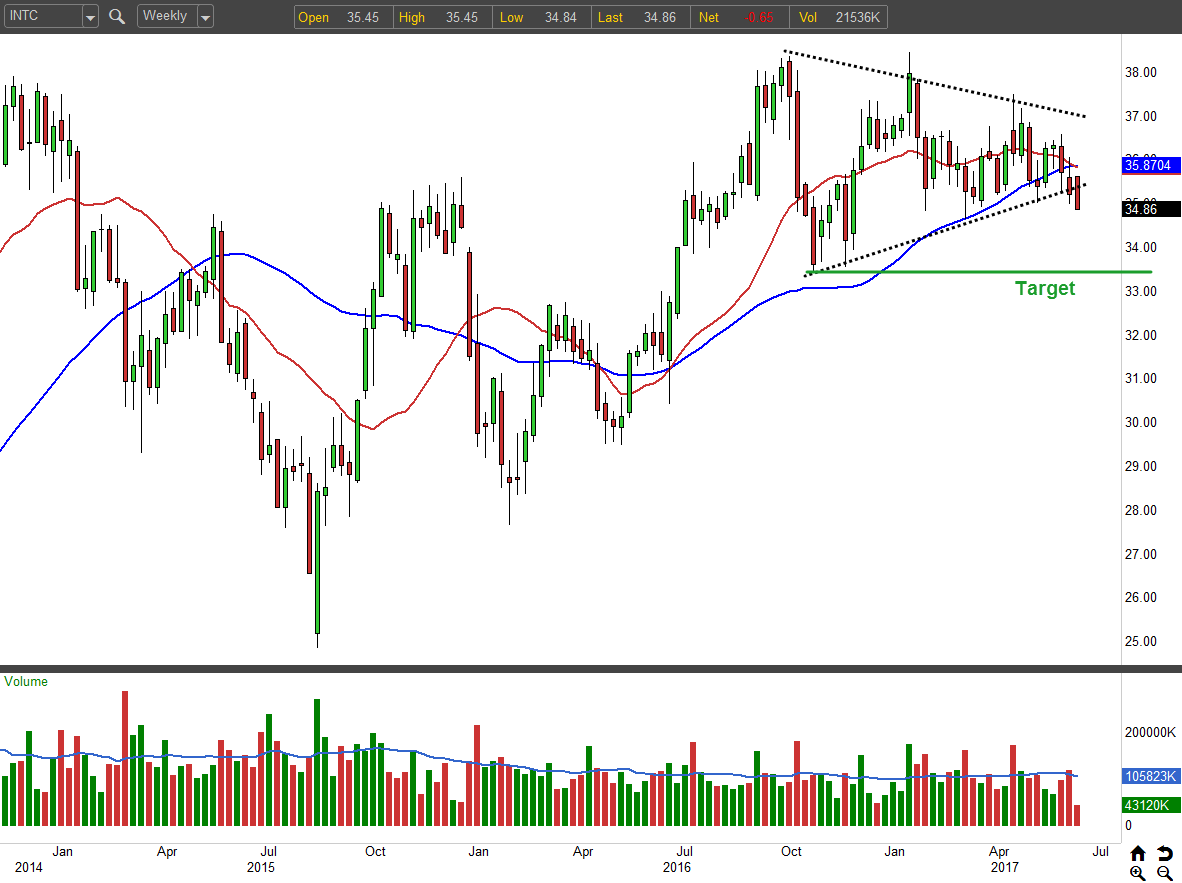
Source: OptionsAnalytix
Technical analysis is far from a perfect prediction tool. What it’s really good at is identifying changes in character. And with Tuesday’s support break, it appears we have a bearish change in character worth talking about. If sellers press their advantage here, look for INTC stock to continue lower toward the $33.40 support level.
We can see the triangle pattern in greater detail by drilling down to a daily chart. Notice how both the 20-day and 50-day moving averages have been crisscrossing in neutral fashion. On a side note, these trend-following tools become virtually worthless in a trading range.

Source: OptionsAnalytix
Intel’s inability to join its fellow semiconductor stocks in their rallies has resulted in drastic relative weakness. The continuous bout of underperformance can be seen in the Comparative Relative Strength (CRS) study in the lower panel.
So, if you’re itching for bearish exposure in semiconductors and are a believer that weakness begets more weakness, then try trading Intel from the short side.
Trade INTC Stock With the Bears
With implied volatility sitting in the middle of the road for Intel’s options, bear put spreads seem like a decent way to go here. Buy the Aug $35/$32 bear put for 92 cents or better.
The vertical spread consists of buying to open the $35 put while selling to open the $32 put. The initial cost of 92 cents represents the max risk and will be lost if the stock sits above $35 at expiration.
The reward is limited to the spread width minus the initial debit, or $2.08, and will be captured if INTC stock can drop below $32 by expiration.
As of this writing, Tyler Craig did not hold a position in any of the aforementioned securities.
More From InvestorPlace
The post Short Intel Corporation (INTC) Stock Into the Semiconductor Slide appeared first on InvestorPlace.
