
 Yahoo Finance
 Sif Holding (AMS:SIFG) Might Be Having Difficulty Using Its Capital Effectively
What are the early trends we should look for to identify a stock that could multiply in value over the long term? Amongst other things, we'll want to see two things; firstly, a growing return on capital employed (ROCE) and secondly, an expansion in the company's amount of capital employed. Put simply, these types of businesses are compounding machines, meaning they are continually reinvesting their earnings at ever-higher rates of return. Having said that, from a first glance at Sif Holding (AMS:SIFG) we aren't jumping out of our chairs at how returns are trending, but let's have a deeper look.
Understanding Return On Capital Employed (ROCE)
For those that aren't sure what ROCE is, it measures the amount of pre-tax profits a company can generate from the capital employed in its business. Analysts use this formula to calculate it for Sif Holding:
Return on Capital Employed = Earnings Before Interest and Tax (EBIT) ÷ (Total Assets - Current Liabilities)
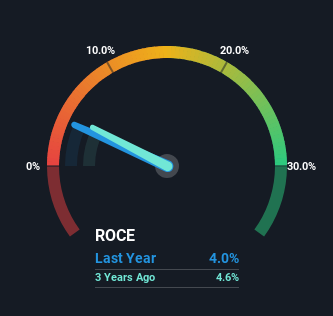
0.04 = €12m ÷ (€418m - €123m) (Based on the trailing twelve months to June 2023).
Thus, Sif Holding has an ROCE of 4.0%. In absolute terms, that's a low return and it also under-performs the Electrical industry average of 13%.
Check out our latest analysis for Sif Holding
Above you can see how the current ROCE for Sif Holding compares to its prior returns on capital, but there's only so much you can tell from the past. If you'd like, you can check out the forecasts from the analysts covering Sif Holding for free.
What Does the ROCE Trend For Sif Holding Tell Us?
On the surface, the trend of ROCE at Sif Holding doesn't inspire confidence. To be more specific, ROCE has fallen from 27% over the last five years. Although, given both revenue and the amount of assets employed in the business have increased, it could suggest the company is investing in growth, and the extra capital has led to a short-term reduction in ROCE. And if the increased capital generates additional returns, the business, and thus shareholders, will benefit in the long run.
On a related note, Sif Holding has decreased its current liabilities to 29% of total assets. That could partly explain why the ROCE has dropped. Effectively this means their suppliers or short-term creditors are funding less of the business, which reduces some elements of risk. Since the business is basically funding more of its operations with it's own money, you could argue this has made the business less efficient at generating ROCE.
Our Take On Sif Holding's ROCE
Even though returns on capital have fallen in the short term, we find it promising that revenue and capital employed have both increased for Sif Holding. These trends are starting to be recognized by investors since the stock has delivered a 4.0% gain to shareholders who've held over the last five years. Therefore we'd recommend looking further into this stock to confirm if it has the makings of a good investment.
One more thing, we've spotted 1 warning sign facing Sif Holding that you might find interesting.
For those who like to invest in solid companies, check out this free list of companies with solid balance sheets and high returns on equity.
Have feedback on this article? Concerned about the content? Get in touch with us directly. Alternatively, email editorial-team (at) simplywallst.com.
This article by Simply Wall St is general in nature. We provide commentary based on historical data and analyst forecasts only using an unbiased methodology and our articles are not intended to be financial advice. It does not constitute a recommendation to buy or sell any stock, and does not take account of your objectives, or your financial situation. We aim to bring you long-term focused analysis driven by fundamental data. Note that our analysis may not factor in the latest price-sensitive company announcements or qualitative material. Simply Wall St has no position in any stocks mentioned.
