
 Yahoo Finance
 Sif Holding's (AMS:SIFG) investors will be pleased with their respectable 50% return over the last three years
Vanguard founder Jack Bogle helped spearhead the low-cost index fund, putting average returns within reach of every investor. But you can make superior returns by picking better-than average stocks. Notably, the Sif Holding N.V. (AMS:SIFG) share price has gained 46% in three years, which is better than the average market return. Also positive was the solid 25% share price increase over the last twelve months.
With that in mind, it's worth seeing if the company's underlying fundamentals have been the driver of long term performance, or if there are some discrepancies.
Check out our latest analysis for Sif Holding
While the efficient markets hypothesis continues to be taught by some, it has been proven that markets are over-reactive dynamic systems, and investors are not always rational. One flawed but reasonable way to assess how sentiment around a company has changed is to compare the earnings per share (EPS) with the share price.
Sif Holding was able to grow its EPS at 9.6% per year over three years, sending the share price higher. In comparison, the 13% per year gain in the share price outpaces the EPS growth. So it's fair to assume the market has a higher opinion of the business than it did three years ago. It's not unusual to see the market 're-rate' a stock, after a few years of growth.
You can see below how EPS has changed over time (discover the exact values by clicking on the image).
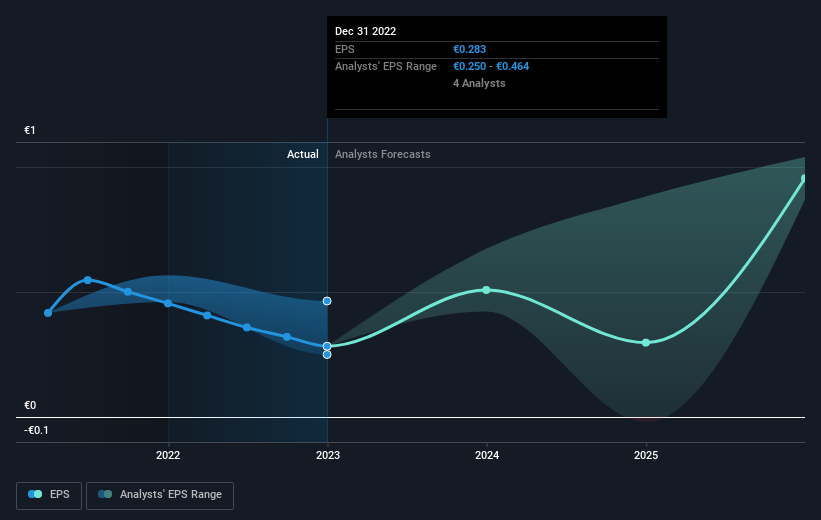
Before buying or selling a stock, we always recommend a close examination of historic growth trends, available here.
What About The Total Shareholder Return (TSR)?
Investors should note that there's a difference between Sif Holding's total shareholder return (TSR) and its share price change, which we've covered above. Arguably the TSR is a more complete return calculation because it accounts for the value of dividends (as if they were reinvested), along with the hypothetical value of any discounted capital that have been offered to shareholders. Dividends have been really beneficial for Sif Holding shareholders, and that cash payout contributed to why its TSR of 50%, over the last 3 years, is better than the share price return.
A Different Perspective
It's nice to see that Sif Holding shareholders have received a total shareholder return of 25% over the last year. That certainly beats the loss of about 5% per year over the last half decade. The long term loss makes us cautious, but the short term TSR gain certainly hints at a brighter future. Before forming an opinion on Sif Holding you might want to consider these 3 valuation metrics.
If you would prefer to check out another company -- one with potentially superior financials -- then do not miss this free list of companies that have proven they can grow earnings.
Please note, the market returns quoted in this article reflect the market weighted average returns of stocks that currently trade on Dutch exchanges.
Have feedback on this article? Concerned about the content? Get in touch with us directly. Alternatively, email editorial-team (at) simplywallst.com.
This article by Simply Wall St is general in nature. We provide commentary based on historical data and analyst forecasts only using an unbiased methodology and our articles are not intended to be financial advice. It does not constitute a recommendation to buy or sell any stock, and does not take account of your objectives, or your financial situation. We aim to bring you long-term focused analysis driven by fundamental data. Note that our analysis may not factor in the latest price-sensitive company announcements or qualitative material. Simply Wall St has no position in any stocks mentioned.
Join A Paid User Research Session
You’ll receive a US$30 Amazon Gift card for 1 hour of your time while helping us build better investing tools for the individual investors like yourself. Sign up here
