
 Yahoo Finance
 Signet Jewelers' (NYSE:SIG) investors will be pleased with their incredible 363% return over the last five years
Buying shares in the best businesses can build meaningful wealth for you and your family. And highest quality companies can see their share prices grow by huge amounts. To wit, the Signet Jewelers Limited (NYSE:SIG) share price has soared 317% over five years. This just goes to show the value creation that some businesses can achieve.
So let's assess the underlying fundamentals over the last 5 years and see if they've moved in lock-step with shareholder returns.
Check out our latest analysis for Signet Jewelers
To quote Buffett, 'Ships will sail around the world but the Flat Earth Society will flourish. There will continue to be wide discrepancies between price and value in the marketplace...' By comparing earnings per share (EPS) and share price changes over time, we can get a feel for how investor attitudes to a company have morphed over time.
During the five years of share price growth, Signet Jewelers moved from a loss to profitability. That kind of transition can be an inflection point that justifies a strong share price gain, just as we have seen here.
The graphic below depicts how EPS has changed over time (unveil the exact values by clicking on the image).
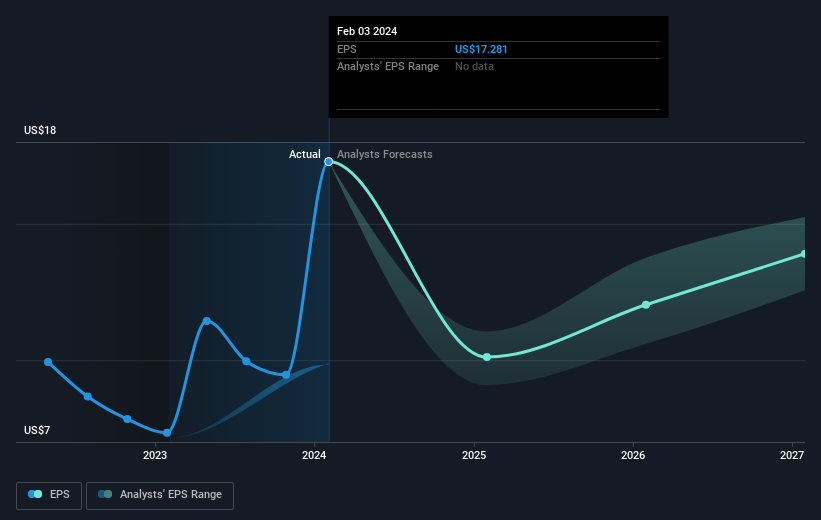
We know that Signet Jewelers has improved its bottom line lately, but is it going to grow revenue? You could check out this free report showing analyst revenue forecasts.
What About Dividends?
As well as measuring the share price return, investors should also consider the total shareholder return (TSR). Whereas the share price return only reflects the change in the share price, the TSR includes the value of dividends (assuming they were reinvested) and the benefit of any discounted capital raising or spin-off. So for companies that pay a generous dividend, the TSR is often a lot higher than the share price return. We note that for Signet Jewelers the TSR over the last 5 years was 363%, which is better than the share price return mentioned above. This is largely a result of its dividend payments!
A Different Perspective
We're pleased to report that Signet Jewelers shareholders have received a total shareholder return of 25% over one year. That's including the dividend. However, the TSR over five years, coming in at 36% per year, is even more impressive. I find it very interesting to look at share price over the long term as a proxy for business performance. But to truly gain insight, we need to consider other information, too. Like risks, for instance. Every company has them, and we've spotted 3 warning signs for Signet Jewelers (of which 2 make us uncomfortable!) you should know about.
We will like Signet Jewelers better if we see some big insider buys. While we wait, check out this free list of growing companies with considerable, recent, insider buying.
Please note, the market returns quoted in this article reflect the market weighted average returns of stocks that currently trade on American exchanges.
Have feedback on this article? Concerned about the content? Get in touch with us directly. Alternatively, email editorial-team (at) simplywallst.com.
This article by Simply Wall St is general in nature. We provide commentary based on historical data and analyst forecasts only using an unbiased methodology and our articles are not intended to be financial advice. It does not constitute a recommendation to buy or sell any stock, and does not take account of your objectives, or your financial situation. We aim to bring you long-term focused analysis driven by fundamental data. Note that our analysis may not factor in the latest price-sensitive company announcements or qualitative material. Simply Wall St has no position in any stocks mentioned.
