
 Yahoo Finance
 As Signify (AMS:LIGHT) increases 3.5% this past week, investors may now be noticing the company's one-year earnings growth
While it may not be enough for some shareholders, we think it is good to see the Signify N.V. (AMS:LIGHT) share price up 11% in a single quarter. But in truth the last year hasn't been good for the share price. In fact, the price has declined 18% in a year, falling short of the returns you could get by investing in an index fund.
While the stock has risen 3.5% in the past week but long term shareholders are still in the red, let's see what the fundamentals can tell us.
See our latest analysis for Signify
While the efficient markets hypothesis continues to be taught by some, it has been proven that markets are over-reactive dynamic systems, and investors are not always rational. One imperfect but simple way to consider how the market perception of a company has shifted is to compare the change in the earnings per share (EPS) with the share price movement.
During the unfortunate twelve months during which the Signify share price fell, it actually saw its earnings per share (EPS) improve by 68%. It's quite possible that growth expectations may have been unreasonable in the past.
It's fair to say that the share price does not seem to be reflecting the EPS growth. So it's well worth checking out some other metrics, too.
Signify's dividend seems healthy to us, so we doubt that the yield is a concern for the market. The revenue trend doesn't seem to explain why the share price is down. Of course, it could simply be that it simply fell short of the market consensus expectations.
You can see below how earnings and revenue have changed over time (discover the exact values by clicking on the image).
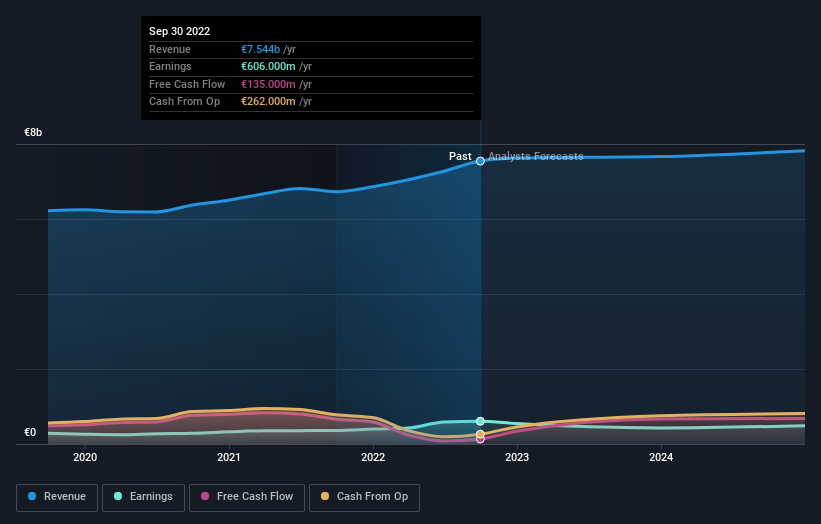
We consider it positive that insiders have made significant purchases in the last year. Having said that, most people consider earnings and revenue growth trends to be a more meaningful guide to the business. You can see what analysts are predicting for Signify in this interactive graph of future profit estimates.
What About Dividends?
As well as measuring the share price return, investors should also consider the total shareholder return (TSR). Whereas the share price return only reflects the change in the share price, the TSR includes the value of dividends (assuming they were reinvested) and the benefit of any discounted capital raising or spin-off. It's fair to say that the TSR gives a more complete picture for stocks that pay a dividend. We note that for Signify the TSR over the last 1 year was -15%, which is better than the share price return mentioned above. And there's no prize for guessing that the dividend payments largely explain the divergence!
A Different Perspective
While the broader market lost about 11% in the twelve months, Signify shareholders did even worse, losing 15% (even including dividends). Having said that, it's inevitable that some stocks will be oversold in a falling market. The key is to keep your eyes on the fundamental developments. Longer term investors wouldn't be so upset, since they would have made 6%, each year, over five years. It could be that the recent sell-off is an opportunity, so it may be worth checking the fundamental data for signs of a long term growth trend. I find it very interesting to look at share price over the long term as a proxy for business performance. But to truly gain insight, we need to consider other information, too. For example, we've discovered 3 warning signs for Signify (2 make us uncomfortable!) that you should be aware of before investing here.
Signify is not the only stock that insiders are buying. For those who like to find winning investments this free list of growing companies with recent insider purchasing, could be just the ticket.
Please note, the market returns quoted in this article reflect the market weighted average returns of stocks that currently trade on NL exchanges.
Have feedback on this article? Concerned about the content? Get in touch with us directly. Alternatively, email editorial-team (at) simplywallst.com.
This article by Simply Wall St is general in nature. We provide commentary based on historical data and analyst forecasts only using an unbiased methodology and our articles are not intended to be financial advice. It does not constitute a recommendation to buy or sell any stock, and does not take account of your objectives, or your financial situation. We aim to bring you long-term focused analysis driven by fundamental data. Note that our analysis may not factor in the latest price-sensitive company announcements or qualitative material. Simply Wall St has no position in any stocks mentioned.
Join A Paid User Research Session
You’ll receive a US$30 Amazon Gift card for 1 hour of your time while helping us build better investing tools for the individual investors like yourself. Sign up here
