
 Yahoo Finance
 The SimplyBiz Group (LON:SBIZ) Share Price Has Gained 31% And Shareholders Are Hoping For More

Want to participate in a short research study? Help shape the future of investing tools and you could win a $250 gift card!
If you want to compound wealth in the stock market, you can do so by buying an index fund. But you can significantly boost your returns by picking above-average stocks. For example, the The SimplyBiz Group plc (LON:SBIZ) share price is up 31% in the last year, clearly besting than the market return of around -4.7% (not including dividends). That's a solid performance by our standards! We'll need to follow SimplyBiz Group for a while to get a better sense of its share price trend, since it hasn't been listed for particularly long.
Check out our latest analysis for SimplyBiz Group
While markets are a powerful pricing mechanism, share prices reflect investor sentiment, not just underlying business performance. By comparing earnings per share (EPS) and share price changes over time, we can get a feel for how investor attitudes to a company have morphed over time.
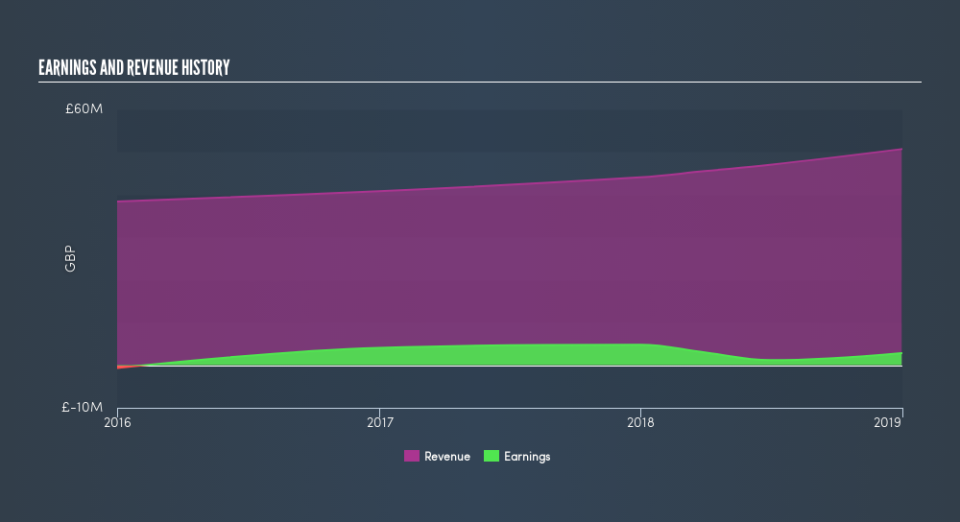
During the last year, SimplyBiz Group actually saw its earnings per share drop 92%. This means it's unlikely the market is judging the company based on earnings growth. Indeed, when EPS is declining but the share price is up, it often means the market is considering other factors.
We are skeptical of the suggestion that the 1.7% dividend yield would entice buyers to the stock. However the year on year revenue growth of 15% would help. Many businesses do go through a faze where they have to forgo some profits to drive business development, and sometimes its for the best.
Depicted in the graphic below, you'll see revenue and earnings over time. If you want more detail, you can click on the chart itself.
It's good to see that there was some significant insider buying in the last three months. That's a positive. On the other hand, we think the revenue and earnings trends are much more meaningful measures of the business. So we recommend checking out this free report showing consensus forecasts
What About Dividends?
When looking at investment returns, it is important to consider the difference between total shareholder return (TSR) and share price return. Whereas the share price return only reflects the change in the share price, the TSR includes the value of dividends (assuming they were reinvested) and the benefit of any discounted capital raising or spin-off. It's fair to say that the TSR gives a more complete picture for stocks that pay a dividend. In the case of SimplyBiz Group, it has a TSR of 33% for the last year. That exceeds its share price return that we previously mentioned. And there's no prize for guessing that the dividend payments largely explain the divergence!
A Different Perspective
SimplyBiz Group boasts a total shareholder return of 33% for the last year(that includes the dividends). A substantial portion of that gain has come in the last three months, with the stock up 22% in that time. This suggests the company is continuing to win over new investors. It is all well and good that insiders have been buying shares, but we suggest you check here to see what price insiders were buying at.
If you like to buy stocks alongside management, then you might just love this free list of companies. (Hint: insiders have been buying them).
Please note, the market returns quoted in this article reflect the market weighted average returns of stocks that currently trade on GB exchanges.
We aim to bring you long-term focused research analysis driven by fundamental data. Note that our analysis may not factor in the latest price-sensitive company announcements or qualitative material.
If you spot an error that warrants correction, please contact the editor at editorial-team@simplywallst.com. This article by Simply Wall St is general in nature. It does not constitute a recommendation to buy or sell any stock, and does not take account of your objectives, or your financial situation. Simply Wall St has no position in the stocks mentioned. Thank you for reading.
