
 Yahoo Finance
 A Sliding Share Price Has Us Looking At NetSol Technologies, Inc.'s (NASDAQ:NTWK) P/E Ratio

Unfortunately for some shareholders, the NetSol Technologies (NASDAQ:NTWK) share price has dived 30% in the last thirty days. And that drop will have no doubt have some shareholders concerned that the 64% share price decline, over the last year, has turned them into bagholders. What is a bagholder? It is a shareholder who has suffered a bad loss, but continues to hold indefinitely, without questioning their reasons for holding, even as the losses grow greater.
All else being equal, a share price drop should make a stock more attractive to potential investors. While the market sentiment towards a stock is very changeable, in the long run, the share price will tend to move in the same direction as earnings per share. So, on certain occasions, long term focussed investors try to take advantage of pessimistic expectations to buy shares at a better price. One way to gauge market expectations of a stock is to look at its Price to Earnings Ratio (PE Ratio). A high P/E implies that investors have high expectations of what a company can achieve compared to a company with a low P/E ratio.
See our latest analysis for NetSol Technologies
Does NetSol Technologies Have A Relatively High Or Low P/E For Its Industry?
NetSol Technologies's P/E of 8.09 indicates relatively low sentiment towards the stock. If you look at the image below, you can see NetSol Technologies has a lower P/E than the average (39.2) in the software industry classification.
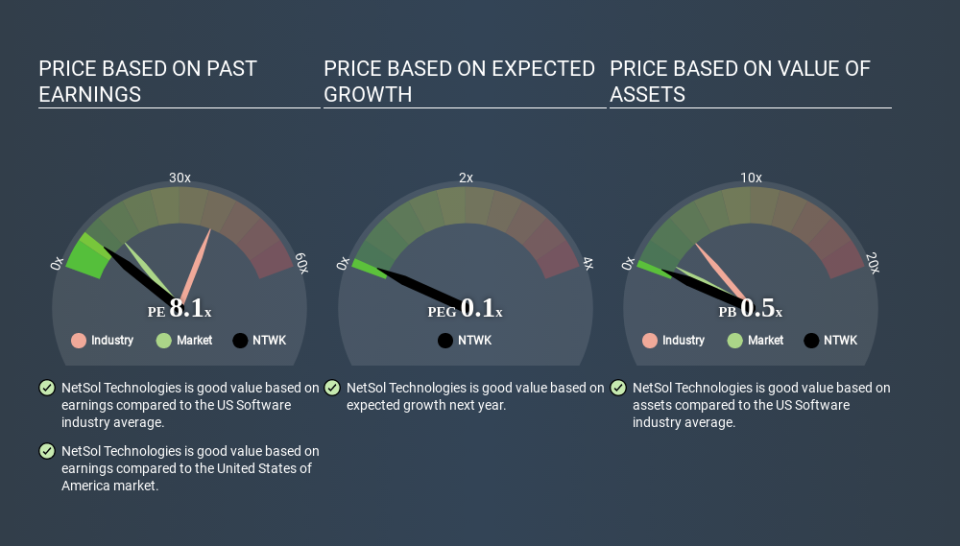
Its relatively low P/E ratio indicates that NetSol Technologies shareholders think it will struggle to do as well as other companies in its industry classification. Since the market seems unimpressed with NetSol Technologies, it's quite possible it could surprise on the upside. You should delve deeper. I like to check if company insiders have been buying or selling.
How Growth Rates Impact P/E Ratios
Generally speaking the rate of earnings growth has a profound impact on a company's P/E multiple. If earnings are growing quickly, then the 'E' in the equation will increase faster than it would otherwise. That means unless the share price increases, the P/E will reduce in a few years. And as that P/E ratio drops, the company will look cheap, unless its share price increases.
NetSol Technologies's earnings per share fell by 56% in the last twelve months. But it has grown its earnings per share by 103% per year over the last three years.
A Limitation: P/E Ratios Ignore Debt and Cash In The Bank
The 'Price' in P/E reflects the market capitalization of the company. So it won't reflect the advantage of cash, or disadvantage of debt. The exact same company would hypothetically deserve a higher P/E ratio if it had a strong balance sheet, than if it had a weak one with lots of debt, because a cashed up company can spend on growth.
Spending on growth might be good or bad a few years later, but the point is that the P/E ratio does not account for the option (or lack thereof).
Is Debt Impacting NetSol Technologies's P/E?
NetSol Technologies has net cash of US$13m. This is fairly high at 45% of its market capitalization. That might mean balance sheet strength is important to the business, but should also help push the P/E a bit higher than it would otherwise be.
The Bottom Line On NetSol Technologies's P/E Ratio
NetSol Technologies trades on a P/E ratio of 8.1, which is below the US market average of 12.9. Falling earnings per share are likely to be keeping potential buyers away, but the net cash position means the company has time to improve: if so, the low P/E could be an opportunity. What can be absolutely certain is that the market has become more pessimistic about NetSol Technologies over the last month, with the P/E ratio falling from 11.6 back then to 8.1 today. For those who prefer invest in growth, this stock apparently offers limited promise, but the deep value investors may find the pessimism around this stock enticing.
Investors have an opportunity when market expectations about a stock are wrong. If it is underestimating a company, investors can make money by buying and holding the shares until the market corrects itself. So this free visual report on analyst forecasts could hold the key to an excellent investment decision.
Of course you might be able to find a better stock than NetSol Technologies. So you may wish to see this free collection of other companies that have grown earnings strongly.
If you spot an error that warrants correction, please contact the editor at editorial-team@simplywallst.com. This article by Simply Wall St is general in nature. It does not constitute a recommendation to buy or sell any stock, and does not take account of your objectives, or your financial situation. Simply Wall St has no position in the stocks mentioned.
We aim to bring you long-term focused research analysis driven by fundamental data. Note that our analysis may not factor in the latest price-sensitive company announcements or qualitative material. Thank you for reading.
