
 Yahoo Finance
 A Sliding Share Price Has Us Looking At Hewlett Packard Enterprise Company's (NYSE:HPE) P/E Ratio

Unfortunately for some shareholders, the Hewlett Packard Enterprise (NYSE:HPE) share price has dived 39% in the last thirty days. That drop has capped off a tough year for shareholders, with the share price down 43% in that time.
Assuming nothing else has changed, a lower share price makes a stock more attractive to potential buyers. While the market sentiment towards a stock is very changeable, in the long run, the share price will tend to move in the same direction as earnings per share. So, on certain occasions, long term focussed investors try to take advantage of pessimistic expectations to buy shares at a better price. Perhaps the simplest way to get a read on investors' expectations of a business is to look at its Price to Earnings Ratio (PE Ratio). A high P/E implies that investors have high expectations of what a company can achieve compared to a company with a low P/E ratio.
Check out our latest analysis for Hewlett Packard Enterprise
Does Hewlett Packard Enterprise Have A Relatively High Or Low P/E For Its Industry?
We can tell from its P/E ratio of 10.05 that sentiment around Hewlett Packard Enterprise isn't particularly high. If you look at the image below, you can see Hewlett Packard Enterprise has a lower P/E than the average (16.9) in the tech industry classification.
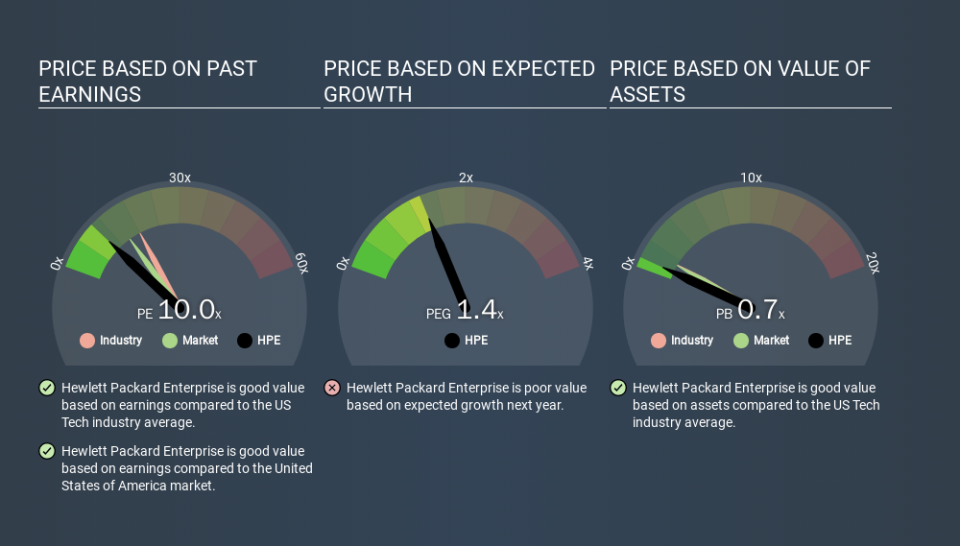
Its relatively low P/E ratio indicates that Hewlett Packard Enterprise shareholders think it will struggle to do as well as other companies in its industry classification. Since the market seems unimpressed with Hewlett Packard Enterprise, it's quite possible it could surprise on the upside. You should delve deeper. I like to check if company insiders have been buying or selling.
How Growth Rates Impact P/E Ratios
Companies that shrink earnings per share quickly will rapidly decrease the 'E' in the equation. That means even if the current P/E is low, it will increase over time if the share price stays flat. Then, a higher P/E might scare off shareholders, pushing the share price down.
In the last year, Hewlett Packard Enterprise grew EPS like Taylor Swift grew her fan base back in 2010; the 90% gain was both fast and well deserved. Unfortunately, earnings per share are down 1.5% a year, over 5 years.
A Limitation: P/E Ratios Ignore Debt and Cash In The Bank
Don't forget that the P/E ratio considers market capitalization. Thus, the metric does not reflect cash or debt held by the company. In theory, a company can lower its future P/E ratio by using cash or debt to invest in growth.
Such spending might be good or bad, overall, but the key point here is that you need to look at debt to understand the P/E ratio in context.
So What Does Hewlett Packard Enterprise's Balance Sheet Tell Us?
Hewlett Packard Enterprise's net debt is 91% of its market cap. This is a reasonably significant level of debt -- all else being equal you'd expect a much lower P/E than if it had net cash.
The Verdict On Hewlett Packard Enterprise's P/E Ratio
Hewlett Packard Enterprise has a P/E of 10.0. That's below the average in the US market, which is 13.3. The company may have significant debt, but EPS growth was good last year. If the company can continue to grow earnings, then the current P/E may be unjustifiably low. Given Hewlett Packard Enterprise's P/E ratio has declined from 16.6 to 10.0 in the last month, we know for sure that the market is significantly less confident about the business today, than it was back then. For those who prefer to invest with the flow of momentum, that might be a bad sign, but for a contrarian, it may signal opportunity.
Investors have an opportunity when market expectations about a stock are wrong. If it is underestimating a company, investors can make money by buying and holding the shares until the market corrects itself. So this free visualization of the analyst consensus on future earnings could help you make the right decision about whether to buy, sell, or hold.
You might be able to find a better buy than Hewlett Packard Enterprise. If you want a selection of possible winners, check out this free list of interesting companies that trade on a P/E below 20 (but have proven they can grow earnings).
If you spot an error that warrants correction, please contact the editor at editorial-team@simplywallst.com. This article by Simply Wall St is general in nature. It does not constitute a recommendation to buy or sell any stock, and does not take account of your objectives, or your financial situation. Simply Wall St has no position in the stocks mentioned.
We aim to bring you long-term focused research analysis driven by fundamental data. Note that our analysis may not factor in the latest price-sensitive company announcements or qualitative material. Thank you for reading.
