
 Yahoo Finance
 A Sliding Share Price Has Us Looking At PBF Energy Inc's (NYSE:PBF) P/E Ratio

Unfortunately for some shareholders, the PBF Energy (NYSE:PBF) share price has dived 74% in the last thirty days. And that drop will have no doubt have some shareholders concerned that the 77% share price decline, over the last year, has turned them into bagholders. What is a bagholder? It is a shareholder who has suffered a bad loss, but continues to hold indefinitely, without questioning their reasons for holding, even as the losses grow greater.
All else being equal, a share price drop should make a stock more attractive to potential investors. In the long term, share prices tend to follow earnings per share, but in the short term prices bounce around in response to short term factors (which are not always obvious). The implication here is that long term investors have an opportunity when expectations of a company are too low. Perhaps the simplest way to get a read on investors' expectations of a business is to look at its Price to Earnings Ratio (PE Ratio). Investors have optimistic expectations of companies with higher P/E ratios, compared to companies with lower P/E ratios.
See our latest analysis for PBF Energy
Does PBF Energy Have A Relatively High Or Low P/E For Its Industry?
We can tell from its P/E ratio of 2.73 that sentiment around PBF Energy isn't particularly high. We can see in the image below that the average P/E (6.5) for companies in the oil and gas industry is higher than PBF Energy's P/E.
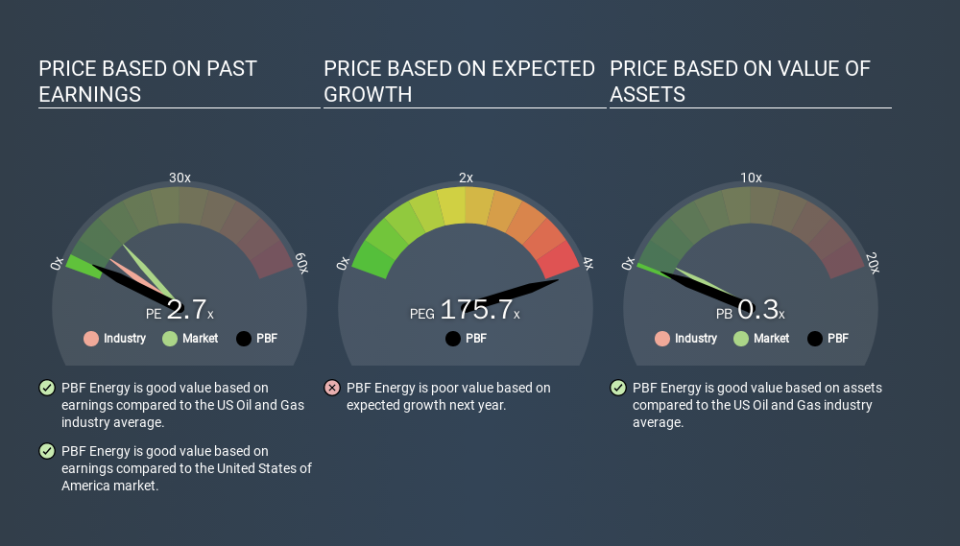
Its relatively low P/E ratio indicates that PBF Energy shareholders think it will struggle to do as well as other companies in its industry classification. While current expectations are low, the stock could be undervalued if the situation is better than the market assumes. If you consider the stock interesting, further research is recommended. For example, I often monitor director buying and selling.
How Growth Rates Impact P/E Ratios
Probably the most important factor in determining what P/E a company trades on is the earnings growth. When earnings grow, the 'E' increases, over time. That means unless the share price increases, the P/E will reduce in a few years. A lower P/E should indicate the stock is cheap relative to others -- and that may attract buyers.
PBF Energy's earnings made like a rocket, taking off 140% last year. And earnings per share have improved by 15% annually, over the last three years. So you might say it really deserves to have an above-average P/E ratio.
Remember: P/E Ratios Don't Consider The Balance Sheet
It's important to note that the P/E ratio considers the market capitalization, not the enterprise value. Thus, the metric does not reflect cash or debt held by the company. In theory, a company can lower its future P/E ratio by using cash or debt to invest in growth.
Spending on growth might be good or bad a few years later, but the point is that the P/E ratio does not account for the option (or lack thereof).
So What Does PBF Energy's Balance Sheet Tell Us?
PBF Energy has net debt worth a very significant 137% of its market capitalization. This is a relatively high level of debt, so the stock probably deserves a relatively low P/E ratio. Keep that in mind when comparing it to other companies.
The Verdict On PBF Energy's P/E Ratio
PBF Energy trades on a P/E ratio of 2.7, which is below the US market average of 12.2. The company has a meaningful amount of debt on the balance sheet, but that should not eclipse the solid earnings growth. If the company can continue to grow earnings, then the current P/E may be unjustifiably low. What can be absolutely certain is that the market has become more pessimistic about PBF Energy over the last month, with the P/E ratio falling from 10.3 back then to 2.7 today. For those who prefer invest in growth, this stock apparently offers limited promise, but the deep value investors may find the pessimism around this stock enticing.
When the market is wrong about a stock, it gives savvy investors an opportunity. If it is underestimating a company, investors can make money by buying and holding the shares until the market corrects itself. So this free report on the analyst consensus forecasts could help you make a master move on this stock.
Of course you might be able to find a better stock than PBF Energy. So you may wish to see this free collection of other companies that have grown earnings strongly.
If you spot an error that warrants correction, please contact the editor at editorial-team@simplywallst.com. This article by Simply Wall St is general in nature. It does not constitute a recommendation to buy or sell any stock, and does not take account of your objectives, or your financial situation. Simply Wall St has no position in the stocks mentioned.
We aim to bring you long-term focused research analysis driven by fundamental data. Note that our analysis may not factor in the latest price-sensitive company announcements or qualitative material. Thank you for reading.
