
 Yahoo Finance
 SM Energy Company (NYSE:SM) Investors Should Think About This Before Buying It For Its Dividend

Want to participate in a short research study? Help shape the future of investing tools and you could win a $250 gift card!
Dividend paying stocks like SM Energy Company (NYSE:SM) tend to be popular with investors, and for good reason - some research suggests a significant amount of all stock market returns come from reinvested dividends. Yet sometimes, investors buy a stock for its dividend and lose money because the share price falls by more than they earned in dividend payments.
A slim 1.0% yield is hard to get excited about, but the long payment history is respectable. At the right price, or with strong growth opportunities, SM Energy could have potential. Remember that the recent share price drop will make SM Energy's yield look higher, even though recent events might have impacted the company's prospects. Some simple analysis can offer a lot of insights when buying a company for its dividend, and we'll go through this below.
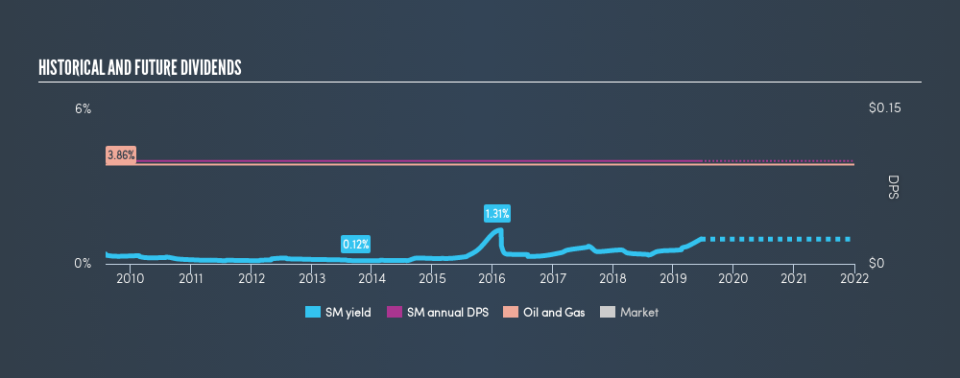
Explore this interactive chart for our latest analysis on SM Energy!
Payout ratios
Dividends are usually paid out of company earnings. If a company is paying more than it earns, then the dividend might become unsustainable - hardly an ideal situation. As a result, we should always investigate whether a company can afford its dividend, measured as a percentage of a company's net income after tax. SM Energy paid out 83% of its profit as dividends, over the trailing twelve month period. Paying out a majority of its earnings limits the amount that can be reinvested in the business. This may indicate a commitment to paying a dividend, or a dearth of investment opportunities.
Another important check we do is to see if the free cash flow generated is sufficient to pay the dividend. Unfortunately, while SM Energy pays a dividend, it also reported negative free cash flow last year. While there may be a good reason for this, it's not ideal from a dividend perspective. It's positive to see that SM Energy's dividend is covered by both profits and cash flow, since this is generally a sign that the dividend is sustainable, and a lower payout ratio usually suggests a greater margin of safety before the dividend gets cut.
Is SM Energy's Balance Sheet Risky?
As SM Energy has a meaningful amount of debt, we need to check its balance sheet to see if the company might have debt risks. A rough way to check this is with these two simple ratios: a) net debt divided by EBITDA (earnings before interest, tax, depreciation and amortisation), and b) net interest cover. Net debt to EBITDA measures a company's total debt load relative to its earnings (lower = less debt), while net interest cover measures the company's ability to pay the interest on its debt (higher = greater ability to pay interest costs). With net debt of 2.90 times its EBITDA, SM Energy's debt burden is within a normal range for most listed companies.
We calculated its interest cover by measuring its earnings before interest and tax (EBIT), and dividing this by the company's net interest expense. With EBIT of less than 1 times its interest expense, SM Energy's financial situation is potentially quite concerning. Readers should investigate whether it might be at risk of breaching the minimum requirements on its loans.
Consider getting our latest analysis on SM Energy's financial position here.
Dividend Volatility
One of the major risks of relying on dividend income, is the potential for a company to struggle financially and cut its dividend. Not only is your income cut, but the value of your investment declines as well - nasty. For the purpose of this article, we only scrutinise the last decade of SM Energy's dividend payments. The dividend has been stable over the past 10 years, which is great. We think this could suggest some resilience to the business and its dividends. Its most recent annual dividend was US$0.10 per share, effectively flat on its first payment ten years ago.
Dividend Growth Potential
Dividend payments have been consistent over the past few years, but we should always check if earnings per share (EPS) are growing, as this will help maintain the purchasing power of the dividend. In the last five years, SM Energy's earnings per share have shrunk at approximately 46% per annum. If earnings continue to decline, the dividend may come under pressure. Every investor should make an assessment of whether the company is taking steps to stabilise the situation.
Conclusion
To summarise, shareholders should always check that SM Energy's dividends are affordable, that its dividend payments are relatively stable, and that it has decent prospects for growing its earnings and dividend. SM Energy gets a pass on its dividend payout ratio, but it paid out virtually all of its cash flow as dividends. This may just be a one-off, but we'd keep an eye on this. Moreover, earnings have been shrinking. While the dividends have been fairly steady, we'd wonder for how much longer this will be sustainable if earnings continue to decline. In summary, SM Energy has a number of shortcomings that we'd find it hard to get past. Things could change, but we think there are likely more attractive alternatives out there.
Given that earnings are not growing, the dividend does not look nearly so attractive. See if the 14 analysts are forecasting a turnaround in our free collection of analyst estimates here.
If you are a dividend investor, you might also want to look at our curated list of dividend stocks yielding above 3%.
We aim to bring you long-term focused research analysis driven by fundamental data. Note that our analysis may not factor in the latest price-sensitive company announcements or qualitative material.
If you spot an error that warrants correction, please contact the editor at editorial-team@simplywallst.com. This article by Simply Wall St is general in nature. It does not constitute a recommendation to buy or sell any stock, and does not take account of your objectives, or your financial situation. Simply Wall St has no position in the stocks mentioned. Thank you for reading.
