
 Yahoo Finance
 Smart Sand (NASDAQ:SND) investors are sitting on a loss of 48% if they invested five years ago
Ideally, your overall portfolio should beat the market average. But every investor is virtually certain to have both over-performing and under-performing stocks. So we wouldn't blame long term Smart Sand, Inc. (NASDAQ:SND) shareholders for doubting their decision to hold, with the stock down 48% over a half decade.
Now let's have a look at the company's fundamentals, and see if the long term shareholder return has matched the performance of the underlying business.
Check out our latest analysis for Smart Sand
There is no denying that markets are sometimes efficient, but prices do not always reflect underlying business performance. One way to examine how market sentiment has changed over time is to look at the interaction between a company's share price and its earnings per share (EPS).
Smart Sand became profitable within the last five years. Most would consider that to be a good thing, so it's counter-intuitive to see the share price declining. Other metrics may better explain the share price move.
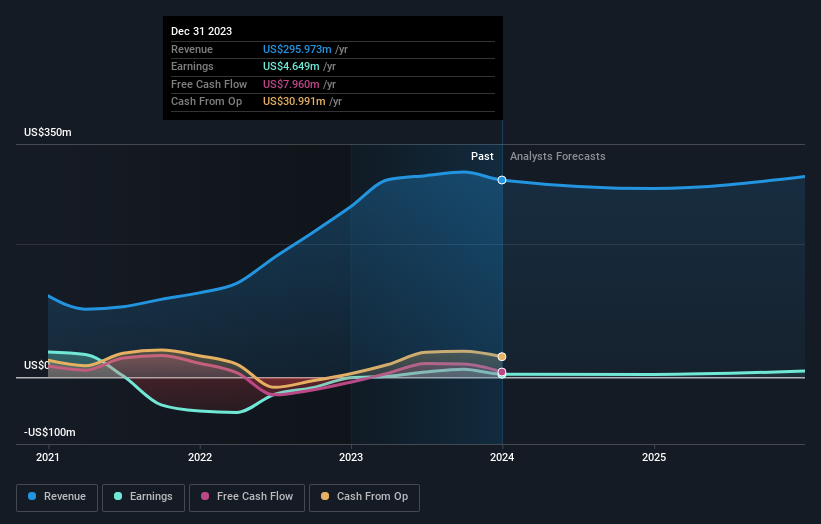
In contrast to the share price, revenue has actually increased by 6.7% a year in the five year period. A more detailed examination of the revenue and earnings may or may not explain why the share price languishes; there could be an opportunity.
You can see how earnings and revenue have changed over time in the image below (click on the chart to see the exact values).
We know that Smart Sand has improved its bottom line lately, but what does the future have in store? This free report showing analyst forecasts should help you form a view on Smart Sand
A Different Perspective
Smart Sand shareholders have received returns of 23% over twelve months, which isn't far from the general market return. To take a positive view, the gain is pleasing, and it sure beats annualized TSR loss of 8%, which was endured over half a decade. While 'turnarounds seldom turn' there are green shoots for Smart Sand. I find it very interesting to look at share price over the long term as a proxy for business performance. But to truly gain insight, we need to consider other information, too. Consider for instance, the ever-present spectre of investment risk. We've identified 3 warning signs with Smart Sand , and understanding them should be part of your investment process.
Of course, you might find a fantastic investment by looking elsewhere. So take a peek at this free list of companies we expect will grow earnings.
Please note, the market returns quoted in this article reflect the market weighted average returns of stocks that currently trade on American exchanges.
Have feedback on this article? Concerned about the content? Get in touch with us directly. Alternatively, email editorial-team (at) simplywallst.com.
This article by Simply Wall St is general in nature. We provide commentary based on historical data and analyst forecasts only using an unbiased methodology and our articles are not intended to be financial advice. It does not constitute a recommendation to buy or sell any stock, and does not take account of your objectives, or your financial situation. We aim to bring you long-term focused analysis driven by fundamental data. Note that our analysis may not factor in the latest price-sensitive company announcements or qualitative material. Simply Wall St has no position in any stocks mentioned.
