
 Yahoo Finance
 Smartgroup (ASX:SIQ) sheds 6.9% this week, as yearly returns fall more in line with earnings growth
It might be of some concern to shareholders to see the Smartgroup Corporation Ltd (ASX:SIQ) share price down 21% in the last month. In contrast the stock is up over the last three years. However, it's unlikely many shareholders are elated with the share price gain of 21% over that time, given the rising market.
In light of the stock dropping 6.9% in the past week, we want to investigate the longer term story, and see if fundamentals have been the driver of the company's positive three-year return.
View our latest analysis for Smartgroup
While markets are a powerful pricing mechanism, share prices reflect investor sentiment, not just underlying business performance. One flawed but reasonable way to assess how sentiment around a company has changed is to compare the earnings per share (EPS) with the share price.
Smartgroup was able to grow its EPS at 14% per year over three years, sending the share price higher. This EPS growth is higher than the 7% average annual increase in the share price. So one could reasonably conclude that the market has cooled on the stock.
The graphic below depicts how EPS has changed over time (unveil the exact values by clicking on the image).
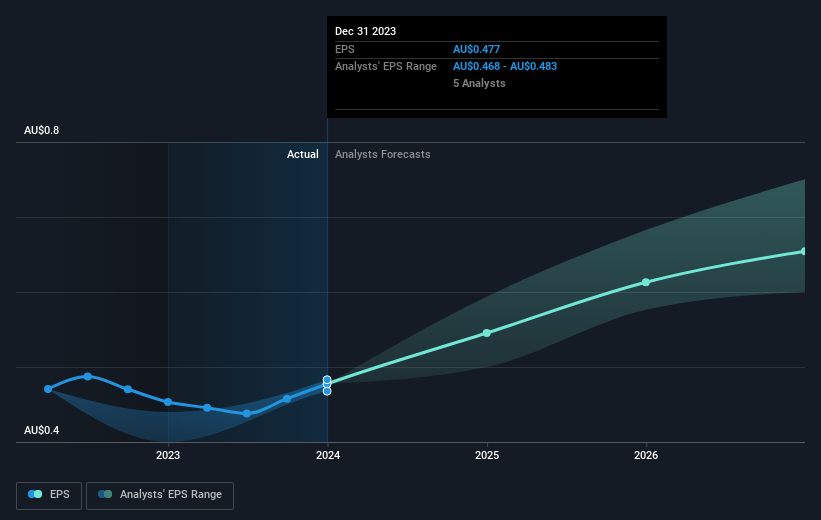
Dive deeper into Smartgroup's key metrics by checking this interactive graph of Smartgroup's earnings, revenue and cash flow.
What About Dividends?
When looking at investment returns, it is important to consider the difference between total shareholder return (TSR) and share price return. The TSR incorporates the value of any spin-offs or discounted capital raisings, along with any dividends, based on the assumption that the dividends are reinvested. So for companies that pay a generous dividend, the TSR is often a lot higher than the share price return. As it happens, Smartgroup's TSR for the last 3 years was 49%, which exceeds the share price return mentioned earlier. This is largely a result of its dividend payments!
A Different Perspective
We're pleased to report that Smartgroup shareholders have received a total shareholder return of 16% over one year. And that does include the dividend. That gain is better than the annual TSR over five years, which is 6%. Therefore it seems like sentiment around the company has been positive lately. Someone with an optimistic perspective could view the recent improvement in TSR as indicating that the business itself is getting better with time. It's always interesting to track share price performance over the longer term. But to understand Smartgroup better, we need to consider many other factors. Case in point: We've spotted 1 warning sign for Smartgroup you should be aware of.
For those who like to find winning investments this free list of growing companies with recent insider purchasing, could be just the ticket.
Please note, the market returns quoted in this article reflect the market weighted average returns of stocks that currently trade on Australian exchanges.
Have feedback on this article? Concerned about the content? Get in touch with us directly. Alternatively, email editorial-team (at) simplywallst.com.
This article by Simply Wall St is general in nature. We provide commentary based on historical data and analyst forecasts only using an unbiased methodology and our articles are not intended to be financial advice. It does not constitute a recommendation to buy or sell any stock, and does not take account of your objectives, or your financial situation. We aim to bring you long-term focused analysis driven by fundamental data. Note that our analysis may not factor in the latest price-sensitive company announcements or qualitative material. Simply Wall St has no position in any stocks mentioned.
