
 Yahoo Finance
 Smartgroup Corporation Ltd's (ASX:SIQ) Stock Has Shown A Decent Performance: Have Financials A Role To Play?
Most readers would already know that Smartgroup's (ASX:SIQ) stock increased by 5.9% over the past three months. We wonder if and what role the company's financials play in that price change as a company's long-term fundamentals usually dictate market outcomes. Specifically, we decided to study Smartgroup's ROE in this article.
Return on equity or ROE is an important factor to be considered by a shareholder because it tells them how effectively their capital is being reinvested. In simpler terms, it measures the profitability of a company in relation to shareholder's equity.
View our latest analysis for Smartgroup
How Is ROE Calculated?
The formula for ROE is:
Return on Equity = Net Profit (from continuing operations) ÷ Shareholders' Equity
So, based on the above formula, the ROE for Smartgroup is:
25% = AU$62m ÷ AU$244m (Based on the trailing twelve months to December 2023).
The 'return' is the profit over the last twelve months. One way to conceptualize this is that for each A$1 of shareholders' capital it has, the company made A$0.25 in profit.
What Is The Relationship Between ROE And Earnings Growth?
So far, we've learned that ROE is a measure of a company's profitability. We now need to evaluate how much profit the company reinvests or "retains" for future growth which then gives us an idea about the growth potential of the company. Assuming everything else remains unchanged, the higher the ROE and profit retention, the higher the growth rate of a company compared to companies that don't necessarily bear these characteristics.
Smartgroup's Earnings Growth And 25% ROE
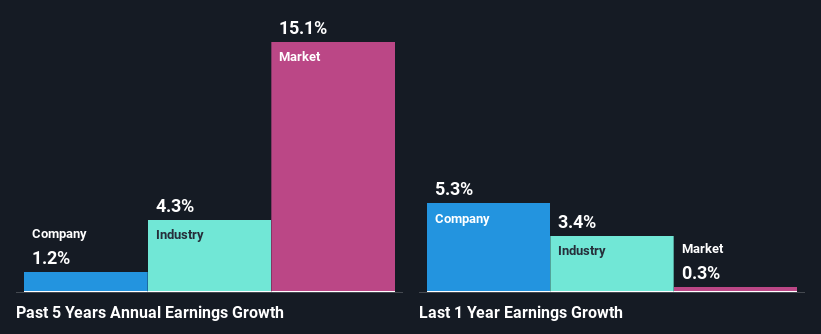
Firstly, we acknowledge that Smartgroup has a significantly high ROE. Secondly, even when compared to the industry average of 19% the company's ROE is quite impressive. However, we are curious as to how the high returns still resulted in a flat growth for Smartgroup in the past five years. We reckon that there could be some other factors at play here that's limiting the company's growth. Such as, the company pays out a huge portion of its earnings as dividends, or is faced with competitive pressures.
We then compared Smartgroup's net income growth with the industry and found that the company's growth figure is lower than the average industry growth rate of 4.3% in the same 5-year period, which is a bit concerning.
The basis for attaching value to a company is, to a great extent, tied to its earnings growth. The investor should try to establish if the expected growth or decline in earnings, whichever the case may be, is priced in. This then helps them determine if the stock is placed for a bright or bleak future. What is SIQ worth today? The intrinsic value infographic in our free research report helps visualize whether SIQ is currently mispriced by the market.
Is Smartgroup Using Its Retained Earnings Effectively?
Smartgroup has a high three-year median payout ratio of 74% (or a retention ratio of 26%), meaning that the company is paying most of its profits as dividends to its shareholders. This does go some way in explaining why there's been no growth in its earnings.
In addition, Smartgroup has been paying dividends over a period of nine years suggesting that keeping up dividend payments is way more important to the management even if it comes at the cost of business growth. Based on the latest analysts' estimates, we found that the company's future payout ratio over the next three years is expected to hold steady at 85%. However, Smartgroup's ROE is predicted to rise to 31% despite there being no anticipated change in its payout ratio.
Conclusion
On the whole, we do feel that Smartgroup has some positive attributes. Although, we are disappointed to see a lack of growth in earnings even in spite of a high ROE. Bear in mind, the company reinvests a small portion of its profits, which means that investors aren't reaping the benefits of the high rate of return. With that said, the latest industry analyst forecasts reveal that the company's earnings are expected to accelerate. To know more about the latest analysts predictions for the company, check out this visualization of analyst forecasts for the company.
Have feedback on this article? Concerned about the content? Get in touch with us directly. Alternatively, email editorial-team (at) simplywallst.com.
This article by Simply Wall St is general in nature. We provide commentary based on historical data and analyst forecasts only using an unbiased methodology and our articles are not intended to be financial advice. It does not constitute a recommendation to buy or sell any stock, and does not take account of your objectives, or your financial situation. We aim to bring you long-term focused analysis driven by fundamental data. Note that our analysis may not factor in the latest price-sensitive company announcements or qualitative material. Simply Wall St has no position in any stocks mentioned.
