
 Yahoo Finance
 Smith & Nephew (LON:SN.) stock falls 5.1% in past week as three-year earnings and shareholder returns continue downward trend
For many investors, the main point of stock picking is to generate higher returns than the overall market. But the risk of stock picking is that you will likely buy under-performing companies. Unfortunately, that's been the case for longer term Smith & Nephew plc (LON:SN.) shareholders, since the share price is down 24% in the last three years, falling well short of the market decline of around 8.4%. On top of that, the share price is down 5.1% in the last week. But this could be related to the soft market, which is down about 4.6% in the same period.
After losing 5.1% this past week, it's worth investigating the company's fundamentals to see what we can infer from past performance.
Check out our latest analysis for Smith & Nephew
To paraphrase Benjamin Graham: Over the short term the market is a voting machine, but over the long term it's a weighing machine. One flawed but reasonable way to assess how sentiment around a company has changed is to compare the earnings per share (EPS) with the share price.
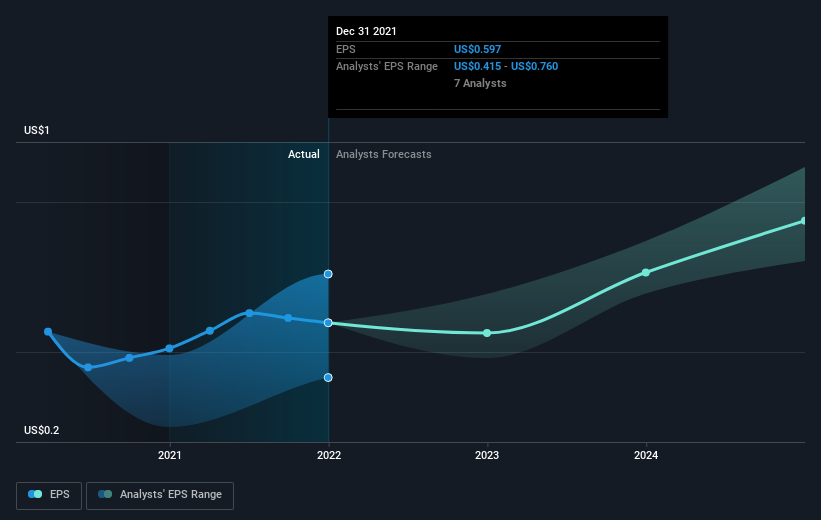
Smith & Nephew saw its EPS decline at a compound rate of 7.5% per year, over the last three years. This fall in EPS isn't far from the rate of share price decline, which was 9% per year. So it seems that investor expectations of the company are staying pretty steady, despite the disappointment. Rather, the share price has approximately tracked EPS growth.
You can see how EPS has changed over time in the image below (click on the chart to see the exact values).
We consider it positive that insiders have made significant purchases in the last year. Even so, future earnings will be far more important to whether current shareholders make money. This free interactive report on Smith & Nephew's earnings, revenue and cash flow is a great place to start, if you want to investigate the stock further.
What About Dividends?
When looking at investment returns, it is important to consider the difference between total shareholder return (TSR) and share price return. Whereas the share price return only reflects the change in the share price, the TSR includes the value of dividends (assuming they were reinvested) and the benefit of any discounted capital raising or spin-off. Arguably, the TSR gives a more comprehensive picture of the return generated by a stock. We note that for Smith & Nephew the TSR over the last 3 years was -19%, which is better than the share price return mentioned above. This is largely a result of its dividend payments!
A Different Perspective
We regret to report that Smith & Nephew shareholders are down 17% for the year (even including dividends). Unfortunately, that's worse than the broader market decline of 1.3%. Having said that, it's inevitable that some stocks will be oversold in a falling market. The key is to keep your eyes on the fundamental developments. Longer term investors wouldn't be so upset, since they would have made 0.5%, each year, over five years. It could be that the recent sell-off is an opportunity, so it may be worth checking the fundamental data for signs of a long term growth trend. If you want to research this stock further, the data on insider buying is an obvious place to start. You can click here to see who has been buying shares - and the price they paid.
If you like to buy stocks alongside management, then you might just love this free list of companies. (Hint: insiders have been buying them).
Please note, the market returns quoted in this article reflect the market weighted average returns of stocks that currently trade on GB exchanges.
Have feedback on this article? Concerned about the content? Get in touch with us directly. Alternatively, email editorial-team (at) simplywallst.com.
This article by Simply Wall St is general in nature. We provide commentary based on historical data and analyst forecasts only using an unbiased methodology and our articles are not intended to be financial advice. It does not constitute a recommendation to buy or sell any stock, and does not take account of your objectives, or your financial situation. We aim to bring you long-term focused analysis driven by fundamental data. Note that our analysis may not factor in the latest price-sensitive company announcements or qualitative material. Simply Wall St has no position in any stocks mentioned.
