
 Yahoo Finance
 Is Smith & Nephew plc’s (LON:SN.) Balance Sheet Strong Enough To Weather A Storm?

The size of Smith & Nephew plc (LSE:SN.), a UK£11.91B large-cap, often attracts investors seeking a reliable investment in the stock market. Big corporations are much sought after by risk-averse investors who find diversified revenue streams and strong capital returns attractive. But, the key to their continued success lies in its financial health. This article will examine Smith & Nephew’s financial liquidity and debt levels to get an idea of whether the company can deal with cyclical downturns and maintain funds to accommodate strategic spending for future growth. Note that this information is centred entirely on financial health and is a high-level overview, so I encourage you to look further into SN. here. View our latest analysis for Smith & Nephew
How does SN.’s operating cash flow stack up against its debt?
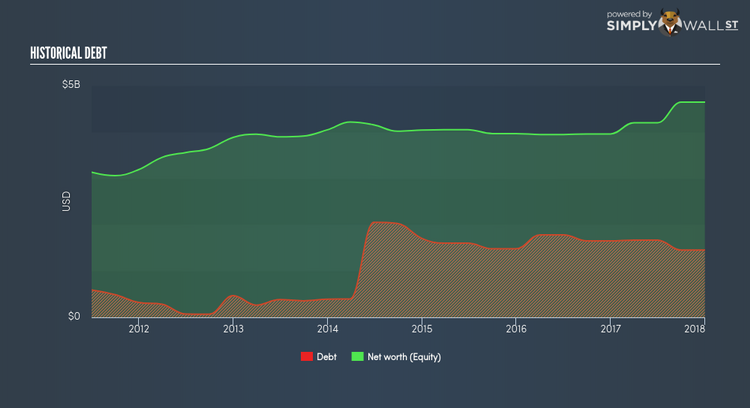
Over the past year, SN. has reduced its debt from US$1.65B to US$1.45B , which comprises of short- and long-term debt. With this reduction in debt, SN.’s cash and short-term investments stands at US$169.00M , ready to deploy into the business. Additionally, SN. has produced cash from operations of US$1.09B over the same time period, leading to an operating cash to total debt ratio of 75.07%, signalling that SN.’s current level of operating cash is high enough to cover debt. This ratio can also be a sign of operational efficiency as an alternative to return on assets. In SN.’s case, it is able to generate 0.75x cash from its debt capital.
Does SN.’s liquid assets cover its short-term commitments?
With current liabilities at US$1.35B, it seems that the business has maintained a safe level of current assets to meet its obligations, with the current ratio last standing at 2.03x. Generally, for Medical Equipment companies, this is a reasonable ratio as there’s enough of a cash buffer without holding too capital in low return investments.
Can SN. service its debt comfortably?
With debt at 31.27% of equity, SN. may be thought of as appropriately levered. SN. is not taking on too much debt commitment, which may be constraining for future growth. We can test if SN.’s debt levels are sustainable by measuring interest payments against earnings of a company. A company generating earnings before interest and tax (EBIT) at least three times its net interest payments is considered financially sound. For SN., the ratio of 17.35x suggests that interest is comfortably covered. It is considered a responsible and reassuring practice to maintain high interest coverage, which makes SN. and other large-cap investments thought to be safe.
Next Steps:
SN. has demonstrated its ability to generate sufficient levels of cash flow, while its debt hovers at an appropriate level. In addition to this, the company exhibits proper management of current assets and upcoming liabilities. This is only a rough assessment of financial health, and I’m sure SN. has company-specific issues impacting its capital structure decisions. I suggest you continue to research Smith & Nephew to get a better picture of the stock by looking at:
Future Outlook: What are well-informed industry analysts predicting for SN.’s future growth? Take a look at our free research report of analyst consensus for SN.’s outlook.
Valuation: What is SN. worth today? Is the stock undervalued, even when its growth outlook is factored into its intrinsic value? The intrinsic value infographic in our free research report helps visualize whether SN. is currently mispriced by the market.
Other High-Performing Stocks: Are there other stocks that provide better prospects with proven track records? Explore our free list of these great stocks here.
To help readers see pass the short term volatility of the financial market, we aim to bring you a long-term focused research analysis purely driven by fundamental data. Note that our analysis does not factor in the latest price sensitive company announcements.
The author is an independent contributor and at the time of publication had no position in the stocks mentioned.
