
 Yahoo Finance
 Société Française de Casinos Société Anonyme (EPA:SFCA): Time For A Financial Health Check

Want to participate in a short research study? Help shape the future of investing tools and receive a $20 prize!
Investors are always looking for growth in small-cap stocks like Société Française de Casinos Société Anonyme (EPA:SFCA), with a market cap of €12m. However, an important fact which most ignore is: how financially healthy is the business? So, understanding the company’s financial health becomes vital, as mismanagement of capital can lead to bankruptcies, which occur at a higher rate for small-caps. Here are few basic financial health checks you should consider before taking the plunge. However, I know these factors are very high-level, so I recommend you dig deeper yourself into SFCA here.
How much cash does SFCA generate through its operations?
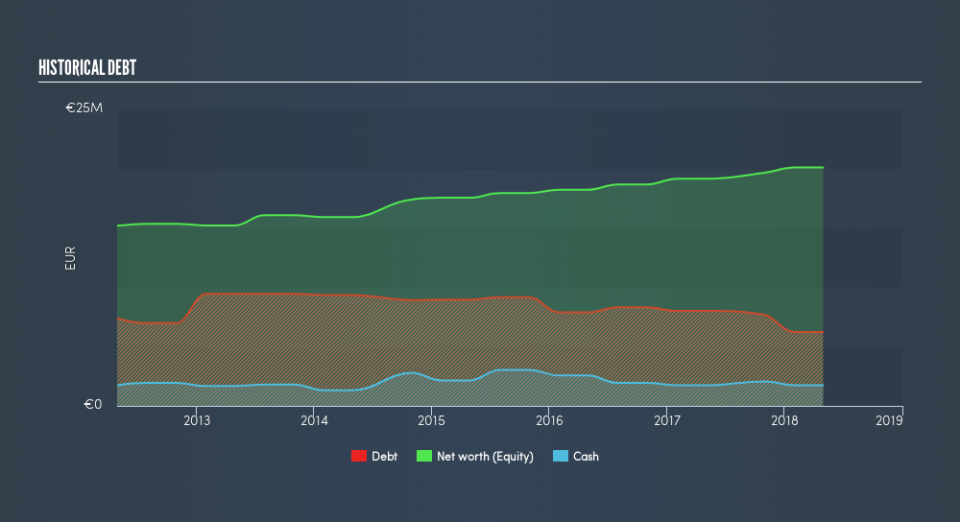
Over the past year, SFCA has reduced its debt from €8.0m to €6.2m , which also accounts for long term debt. With this debt payback, SFCA currently has €1.7m remaining in cash and short-term investments for investing into the business. Additionally, SFCA has produced €2.4m in operating cash flow during the same period of time, resulting in an operating cash to total debt ratio of 38%, indicating that SFCA’s current level of operating cash is high enough to cover debt. This ratio can also be interpreted as a measure of efficiency as an alternative to return on assets. In SFCA’s case, it is able to generate 0.38x cash from its debt capital.
Does SFCA’s liquid assets cover its short-term commitments?
Looking at SFCA’s €11m in current liabilities, the company arguably has a rather low level of current assets relative its obligations, with the current ratio last standing at 0.75x.
Is SFCA’s debt level acceptable?
With a debt-to-equity ratio of 31%, SFCA’s debt level may be seen as prudent. SFCA is not taking on too much debt commitment, which may be constraining for future growth. We can check to see whether SFCA is able to meet its debt obligations by looking at the net interest coverage ratio. A company generating earnings before interest and tax (EBIT) at least three times its net interest payments is considered financially sound. In SFCA’s, case, the ratio of 0.83x suggests that interest is not strongly covered, which means that lenders may refuse to lend the company more money, as it is seen as too risky in terms of default.
Next Steps:
SFCA has demonstrated its ability to generate sufficient levels of cash flow, while its debt hovers at an appropriate level. Though its low liquidity raises concerns over whether current asset management practices are properly implemented for the small-cap. I admit this is a fairly basic analysis for SFCA’s financial health. Other important fundamentals need to be considered alongside. I suggest you continue to research Société Française de Casinos Société Anonyme to get a better picture of the stock by looking at:
Future Outlook: What are well-informed industry analysts predicting for SFCA’s future growth? Take a look at our free research report of analyst consensus for SFCA’s outlook.
Historical Performance: What has SFCA’s returns been like over the past? Go into more detail in the past track record analysis and take a look at the free visual representations of our analysis for more clarity.
Other High-Performing Stocks: Are there other stocks that provide better prospects with proven track records? Explore our free list of these great stocks here.
We aim to bring you long-term focused research analysis driven by fundamental data. Note that our analysis may not factor in the latest price-sensitive company announcements or qualitative material.
If you spot an error that warrants correction, please contact the editor at editorial-team@simplywallst.com. This article by Simply Wall St is general in nature. It does not constitute a recommendation to buy or sell any stock, and does not take account of your objectives, or your financial situation. Simply Wall St has no position in the stocks mentioned. Thank you for reading.
