
 Yahoo Finance
 Has Software Aktiengesellschaft (ETR:SOW) Got Enough Cash?

Want to participate in a research study? Help shape the future of investing tools and earn a $60 gift card!
Stocks with market capitalization between $2B and $10B, such as Software Aktiengesellschaft (ETR:SOW) with a size of €2.3b, do not attract as much attention from the investing community as do the small-caps and large-caps. While they are less talked about as an investment category, mid-cap risk-adjusted returns have generally been better than more commonly focused stocks that fall into the small- or large-cap categories. Today we will look at SOW’s financial liquidity and debt levels, which are strong indicators for whether the company can weather economic downturns or fund strategic acquisitions for future growth. Don’t forget that this is a general and concentrated examination of Software's financial health, so you should conduct further analysis into SOW here.
See our latest analysis for Software
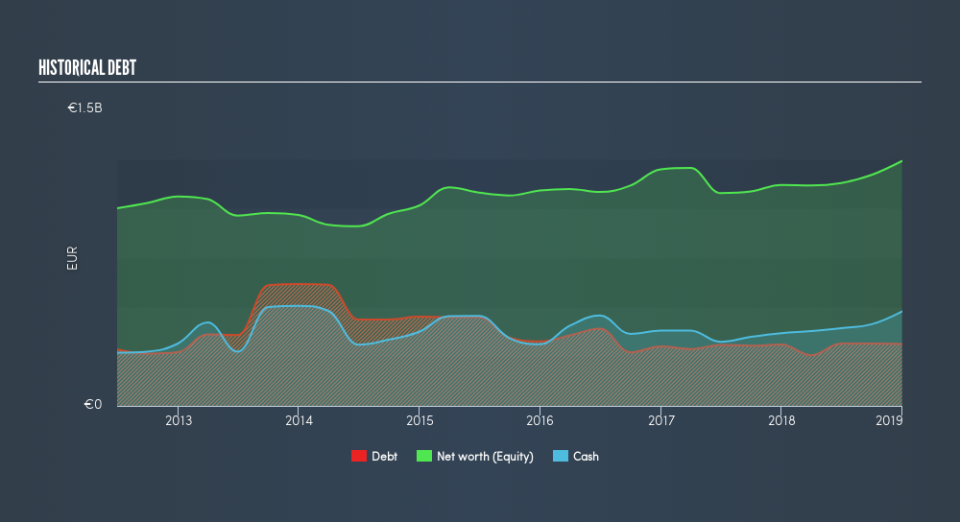
SOW’s Debt (And Cash Flows)
SOW's debt level has been constant at around €313m over the previous year which accounts for long term debt. At this constant level of debt, the current cash and short-term investment levels stands at €478m to keep the business going. On top of this, SOW has produced cash from operations of €195m over the same time period, resulting in an operating cash to total debt ratio of 62%, indicating that SOW’s debt is appropriately covered by operating cash.
Can SOW meet its short-term obligations with the cash in hand?
With current liabilities at €488m, the company has been able to meet these obligations given the level of current assets of €725m, with a current ratio of 1.48x. The current ratio is the number you get when you divide current assets by current liabilities. For Software companies, this ratio is within a sensible range since there's a sufficient cash cushion without leaving too much capital idle or in low-earning investments.
Is SOW’s debt level acceptable?
SOW’s level of debt is appropriate relative to its total equity, at 25%. SOW is not taking on too much debt commitment, which may be constraining for future growth.
Next Steps:
SOW has demonstrated its ability to generate sufficient levels of cash flow, while its debt hovers at an appropriate level. In addition to this, the company will be able to pay all of its upcoming liabilities from its current short-term assets. Keep in mind I haven't considered other factors such as how SOW has been performing in the past. I suggest you continue to research Software to get a more holistic view of the stock by looking at:
Future Outlook: What are well-informed industry analysts predicting for SOW’s future growth? Take a look at our free research report of analyst consensus for SOW’s outlook.
Valuation: What is SOW worth today? Is the stock undervalued, even when its growth outlook is factored into its intrinsic value? The intrinsic value infographic in our free research report helps visualize whether SOW is currently mispriced by the market.
Other High-Performing Stocks: Are there other stocks that provide better prospects with proven track records? Explore our free list of these great stocks here.
We aim to bring you long-term focused research analysis driven by fundamental data. Note that our analysis may not factor in the latest price-sensitive company announcements or qualitative material.
If you spot an error that warrants correction, please contact the editor at editorial-team@simplywallst.com. This article by Simply Wall St is general in nature. It does not constitute a recommendation to buy or sell any stock, and does not take account of your objectives, or your financial situation. Simply Wall St has no position in the stocks mentioned. Thank you for reading.
