
 Yahoo Finance
 SolarEdge Technologies (NASDAQ:SEDG) Might Be Having Difficulty Using Its Capital Effectively
If we want to find a potential multi-bagger, often there are underlying trends that can provide clues. Amongst other things, we'll want to see two things; firstly, a growing return on capital employed (ROCE) and secondly, an expansion in the company's amount of capital employed. Basically this means that a company has profitable initiatives that it can continue to reinvest in, which is a trait of a compounding machine. However, after briefly looking over the numbers, we don't think SolarEdge Technologies (NASDAQ:SEDG) has the makings of a multi-bagger going forward, but let's have a look at why that may be.
Understanding Return On Capital Employed (ROCE)
Just to clarify if you're unsure, ROCE is a metric for evaluating how much pre-tax income (in percentage terms) a company earns on the capital invested in its business. The formula for this calculation on SolarEdge Technologies is:
Return on Capital Employed = Earnings Before Interest and Tax (EBIT) ÷ (Total Assets - Current Liabilities)
0.068 = US$213m ÷ (US$3.7b - US$569m) (Based on the trailing twelve months to March 2022).
Therefore, SolarEdge Technologies has an ROCE of 6.8%. In absolute terms, that's a low return and it also under-performs the Semiconductor industry average of 14%.
View our latest analysis for SolarEdge Technologies
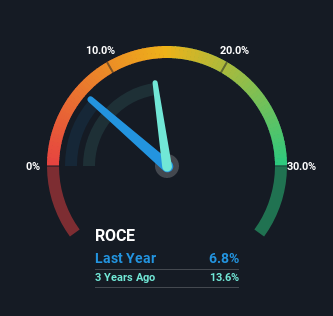
In the above chart we have measured SolarEdge Technologies' prior ROCE against its prior performance, but the future is arguably more important. If you'd like, you can check out the forecasts from the analysts covering SolarEdge Technologies here for free.
So How Is SolarEdge Technologies' ROCE Trending?
On the surface, the trend of ROCE at SolarEdge Technologies doesn't inspire confidence. To be more specific, ROCE has fallen from 17% over the last five years. Although, given both revenue and the amount of assets employed in the business have increased, it could suggest the company is investing in growth, and the extra capital has led to a short-term reduction in ROCE. And if the increased capital generates additional returns, the business, and thus shareholders, will benefit in the long run.
The Bottom Line
While returns have fallen for SolarEdge Technologies in recent times, we're encouraged to see that sales are growing and that the business is reinvesting in its operations. And long term investors must be optimistic going forward because the stock has returned a huge 1,131% to shareholders in the last five years. So while the underlying trends could already be accounted for by investors, we still think this stock is worth looking into further.
One final note, you should learn about the 3 warning signs we've spotted with SolarEdge Technologies (including 1 which can't be ignored) .
If you want to search for solid companies with great earnings, check out this free list of companies with good balance sheets and impressive returns on equity.
Have feedback on this article? Concerned about the content? Get in touch with us directly. Alternatively, email editorial-team (at) simplywallst.com.
This article by Simply Wall St is general in nature. We provide commentary based on historical data and analyst forecasts only using an unbiased methodology and our articles are not intended to be financial advice. It does not constitute a recommendation to buy or sell any stock, and does not take account of your objectives, or your financial situation. We aim to bring you long-term focused analysis driven by fundamental data. Note that our analysis may not factor in the latest price-sensitive company announcements or qualitative material. Simply Wall St has no position in any stocks mentioned.
