
 Yahoo Finance
 Solid State (LON:SOLI) May Have Issues Allocating Its Capital
To find a multi-bagger stock, what are the underlying trends we should look for in a business? Ideally, a business will show two trends; firstly a growing return on capital employed (ROCE) and secondly, an increasing amount of capital employed. Ultimately, this demonstrates that it's a business that is reinvesting profits at increasing rates of return. However, after briefly looking over the numbers, we don't think Solid State (LON:SOLI) has the makings of a multi-bagger going forward, but let's have a look at why that may be.
Return On Capital Employed (ROCE): What is it?
Just to clarify if you're unsure, ROCE is a metric for evaluating how much pre-tax income (in percentage terms) a company earns on the capital invested in its business. Analysts use this formula to calculate it for Solid State:
Return on Capital Employed = Earnings Before Interest and Tax (EBIT) ÷ (Total Assets - Current Liabilities)
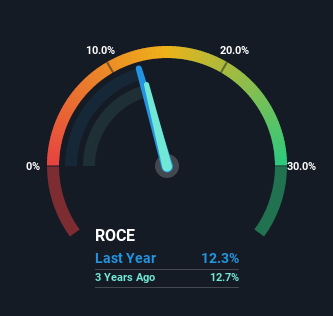
0.12 = UK£4.1m ÷ (UK£55m - UK£21m) (Based on the trailing twelve months to September 2021).
Therefore, Solid State has an ROCE of 12%. That's a relatively normal return on capital, and it's around the 11% generated by the Electronic industry.
See our latest analysis for Solid State
Above you can see how the current ROCE for Solid State compares to its prior returns on capital, but there's only so much you can tell from the past. If you're interested, you can view the analysts predictions in our free report on analyst forecasts for the company.
How Are Returns Trending?
In terms of Solid State's historical ROCE movements, the trend isn't fantastic. To be more specific, ROCE has fallen from 18% over the last five years. On the other hand, the company has been employing more capital without a corresponding improvement in sales in the last year, which could suggest these investments are longer term plays. It may take some time before the company starts to see any change in earnings from these investments.
While on the subject, we noticed that the ratio of current liabilities to total assets has risen to 39%, which has impacted the ROCE. Without this increase, it's likely that ROCE would be even lower than 12%. Keep an eye on this ratio, because the business could encounter some new risks if this metric gets too high.
The Bottom Line On Solid State's ROCE
Bringing it all together, while we're somewhat encouraged by Solid State's reinvestment in its own business, we're aware that returns are shrinking. Investors must think there's better things to come because the stock has knocked it out of the park, delivering a 178% gain to shareholders who have held over the last five years. However, unless these underlying trends turn more positive, we wouldn't get our hopes up too high.
On a final note, we've found 1 warning sign for Solid State that we think you should be aware of.
If you want to search for solid companies with great earnings, check out this free list of companies with good balance sheets and impressive returns on equity.
Have feedback on this article? Concerned about the content? Get in touch with us directly. Alternatively, email editorial-team (at) simplywallst.com.
This article by Simply Wall St is general in nature. We provide commentary based on historical data and analyst forecasts only using an unbiased methodology and our articles are not intended to be financial advice. It does not constitute a recommendation to buy or sell any stock, and does not take account of your objectives, or your financial situation. We aim to bring you long-term focused analysis driven by fundamental data. Note that our analysis may not factor in the latest price-sensitive company announcements or qualitative material. Simply Wall St has no position in any stocks mentioned.
Join A Paid User Research Session
You’ll receive a US$30 Amazon Gift card for 1 hour of your time while helping us build better investing tools for the individual investors like yourself. Sign up here
