
 Yahoo Finance
 Solid State (LON:SOLI) shareholders have earned a 19% CAGR over the last five years
The most you can lose on any stock (assuming you don't use leverage) is 100% of your money. But on a lighter note, a good company can see its share price rise well over 100%. For instance, the price of Solid State plc (LON:SOLI) stock is up an impressive 114% over the last five years.
Let's take a look at the underlying fundamentals over the longer term, and see if they've been consistent with shareholders returns.
View our latest analysis for Solid State
There is no denying that markets are sometimes efficient, but prices do not always reflect underlying business performance. One flawed but reasonable way to assess how sentiment around a company has changed is to compare the earnings per share (EPS) with the share price.
Solid State's earnings per share are down 3.9% per year, despite strong share price performance over five years.
By glancing at these numbers, we'd posit that the decline in earnings per share is not representative of how the business has changed over the years. Since the change in EPS doesn't seem to correlate with the change in share price, it's worth taking a look at other metrics.
The modest 1.9% dividend yield is unlikely to be propping up the share price. On the other hand, Solid State's revenue is growing nicely, at a compound rate of 14% over the last five years. It's quite possible that management are prioritizing revenue growth over EPS growth at the moment.
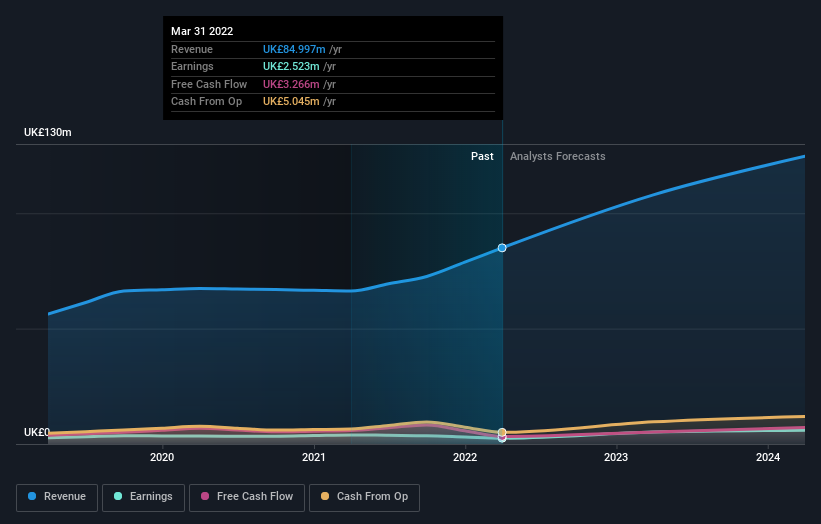
The image below shows how earnings and revenue have tracked over time (if you click on the image you can see greater detail).
You can see how its balance sheet has strengthened (or weakened) over time in this free interactive graphic.
What About Dividends?
As well as measuring the share price return, investors should also consider the total shareholder return (TSR). Whereas the share price return only reflects the change in the share price, the TSR includes the value of dividends (assuming they were reinvested) and the benefit of any discounted capital raising or spin-off. So for companies that pay a generous dividend, the TSR is often a lot higher than the share price return. We note that for Solid State the TSR over the last 5 years was 142%, which is better than the share price return mentioned above. And there's no prize for guessing that the dividend payments largely explain the divergence!
A Different Perspective
While it's never nice to take a loss, Solid State shareholders can take comfort that , including dividends,their trailing twelve month loss of 3.9% wasn't as bad as the market loss of around 14%. Longer term investors wouldn't be so upset, since they would have made 19%, each year, over five years. It could be that the business is just facing some short term problems, but shareholders should keep a close eye on the fundamentals. I find it very interesting to look at share price over the long term as a proxy for business performance. But to truly gain insight, we need to consider other information, too. Consider for instance, the ever-present spectre of investment risk. We've identified 3 warning signs with Solid State , and understanding them should be part of your investment process.
If you like to buy stocks alongside management, then you might just love this free list of companies. (Hint: insiders have been buying them).
Please note, the market returns quoted in this article reflect the market weighted average returns of stocks that currently trade on GB exchanges.
Have feedback on this article? Concerned about the content? Get in touch with us directly. Alternatively, email editorial-team (at) simplywallst.com.
This article by Simply Wall St is general in nature. We provide commentary based on historical data and analyst forecasts only using an unbiased methodology and our articles are not intended to be financial advice. It does not constitute a recommendation to buy or sell any stock, and does not take account of your objectives, or your financial situation. We aim to bring you long-term focused analysis driven by fundamental data. Note that our analysis may not factor in the latest price-sensitive company announcements or qualitative material. Simply Wall St has no position in any stocks mentioned.
Join A Paid User Research Session
You’ll receive a US$30 Amazon Gift card for 1 hour of your time while helping us build better investing tools for the individual investors like yourself. Sign up here
