
 Yahoo Finance
 Is Somero Enterprises, Inc.'s(LON:SOM) Recent Stock Performance Tethered To Its Strong Fundamentals?
Somero Enterprises (LON:SOM) has had a great run on the share market with its stock up by a significant 22% over the last three months. Since the market usually pay for a company’s long-term fundamentals, we decided to study the company’s key performance indicators to see if they could be influencing the market. Particularly, we will be paying attention to Somero Enterprises' ROE today.
Return on equity or ROE is a key measure used to assess how efficiently a company's management is utilizing the company's capital. Simply put, it is used to assess the profitability of a company in relation to its equity capital.
Check out our latest analysis for Somero Enterprises
How To Calculate Return On Equity?
ROE can be calculated by using the formula:
Return on Equity = Net Profit (from continuing operations) ÷ Shareholders' Equity
So, based on the above formula, the ROE for Somero Enterprises is:
30% = US$19m ÷ US$64m (Based on the trailing twelve months to December 2020).
The 'return' refers to a company's earnings over the last year. One way to conceptualize this is that for each £1 of shareholders' capital it has, the company made £0.30 in profit.
What Is The Relationship Between ROE And Earnings Growth?
Thus far, we have learned that ROE measures how efficiently a company is generating its profits. We now need to evaluate how much profit the company reinvests or "retains" for future growth which then gives us an idea about the growth potential of the company. Assuming everything else remains unchanged, the higher the ROE and profit retention, the higher the growth rate of a company compared to companies that don't necessarily bear these characteristics.
A Side By Side comparison of Somero Enterprises' Earnings Growth And 30% ROE
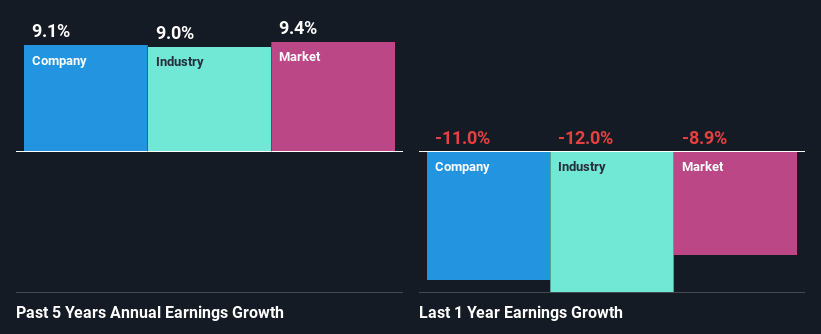
First thing first, we like that Somero Enterprises has an impressive ROE. Additionally, the company's ROE is higher compared to the industry average of 11% which is quite remarkable. This likely paved the way for the modest 9.1% net income growth seen by Somero Enterprises over the past five years. growth
Next, on comparing Somero Enterprises' net income growth with the industry, we found that the company's reported growth is similar to the industry average growth rate of 9.0% in the same period.
The basis for attaching value to a company is, to a great extent, tied to its earnings growth. It’s important for an investor to know whether the market has priced in the company's expected earnings growth (or decline). By doing so, they will have an idea if the stock is headed into clear blue waters or if swampy waters await. Is Somero Enterprises fairly valued compared to other companies? These 3 valuation measures might help you decide.
Is Somero Enterprises Making Efficient Use Of Its Profits?
Somero Enterprises has a significant three-year median payout ratio of 51%, meaning that it is left with only 49% to reinvest into its business. This implies that the company has been able to achieve decent earnings growth despite returning most of its profits to shareholders.
Besides, Somero Enterprises has been paying dividends over a period of eight years. This shows that the company is committed to sharing profits with its shareholders.
Conclusion
Overall, we are quite pleased with Somero Enterprises' performance. We are particularly impressed by the considerable earnings growth posted by the company, which was likely backed by its high ROE. While the company is paying out most of its earnings as dividends, it has been able to grow its earnings in spite of it, so that's probably a good sign. So far, we've only made a quick discussion around the company's earnings growth. You can do your own research on Somero Enterprises and see how it has performed in the past by looking at this FREE detailed graph of past earnings, revenue and cash flows.
This article by Simply Wall St is general in nature. It does not constitute a recommendation to buy or sell any stock, and does not take account of your objectives, or your financial situation. We aim to bring you long-term focused analysis driven by fundamental data. Note that our analysis may not factor in the latest price-sensitive company announcements or qualitative material. Simply Wall St has no position in any stocks mentioned.
Have feedback on this article? Concerned about the content? Get in touch with us directly. Alternatively, email editorial-team (at) simplywallst.com.
