
 Yahoo Finance
 Southwest Airlines (LUV) Q2 Earnings & Revenues Top Estimates

Southwest Airlines Co. (LUV) reported second-quarter 2023 earnings per share (EPS) of $1.09, which outpaced the Zacks Consensus Estimate of $1.08 but declined 16.2% on a year-over-year basis.
Revenues of $7,037 million beat the Zacks Consensus Estimate of $6,988.7 million and improved 4.6% year over year on solid leisure demand.
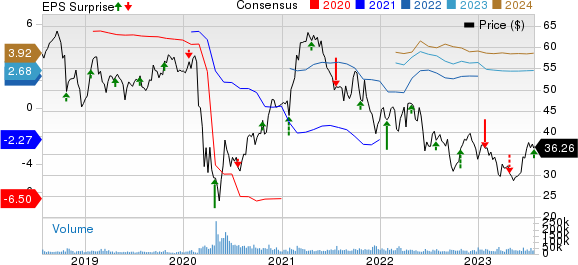
Southwest Airlines Co. Price, Consensus and EPS Surprise
Southwest Airlines Co. price-consensus-eps-surprise-chart | Southwest Airlines Co. Quote
Operating Statistics
Airline traffic, measured in revenue passenger miles, jumped 9.2% year over year to 35.50 billion in the quarter under review. Capacity or available seat miles (ASMs) climbed 14.1% year over year to 42.58 billion. The load factor (percentage of seats filled by passengers) fell to 83.4% from 87.1% in the year-ago quarter.
Passenger revenue per available seat mile (a key measure of unit revenues) descended 8.2% year over year to 15.05 cents. Revenue per available seat mile fell 8.3% to 16.53 cents.
Operating Expenses & Income
In the second quarter, Southwest Airlines incurred an operating income (as reported) of $795 million, down 31.3% year over year. On an adjusted basis (excluding special items), the company reported operating income of $807 million, down 31.2% year over year. Total adjusted operating expenses (excluding profit sharing, special items, fuel and oil expenses) increased 22.6%.
Fuel cost per gallon (inclusive of fuel tax: economic) fell 22.6% to $2.60. Consolidated unit cost or cost per available seat mile (CASM) excluding fuel, oil and profit-sharing expenses, and special items increased 7.5% year over year.
Liquidity
Southwest Airlines ended the second quarter with cash and cash equivalents of $9,158 million compared with $8,359 million at the end of March 2023. As of Jun 30, 2023, the company had long-term debt (less current maturities) of $7,994 million compared with $7,999 million at March 2023-end.
LUV generated $1,416 million of cash from operating activities in the reported quarter, while CapEx was $925 million.
Q3 & Full-Year Outlook
For third-quarter 2023, ASMs are estimated to improve 12% from the year-ago reported figure. Economic fuel costs per gallonare expected to be between $2.55 and $2.65. LUV expects CASM, excluding fuel, oil and profit-sharing expenses, and special items, to increase 3.5-6.5% in the third quarter from the comparable period in 2022. Interest expenses are expected to be $63 million in the third quarter.
For 2023, Southwest Airlines continues to expect capacity improvement in the range of 14-15% from the 2022 level. Economic fuel costs per gallon are now estimated to be between $2.70 and $2.80 (prior view: $2.60 and $2.70). CASM, excluding fuel, oil and profit-sharing expenses, and special items, is now anticipated to decrease 1-2% (prior view: down 2-4%) in 2023 from 2022.
Interest expenses are now expected to be $255 million (prior view: $250 million) in 2023. The effective tax rate is still expected to be in the band of 23-24% for the year. Capital expenditures are still anticipated at around $3.5 billion for 2023.
Currently, Southwest Airlines carries a Zacks Rank #3 (Hold). You can see the complete list of today’s Zacks #1 Rank (Strong Buy) stocks here.
Performances of Other Transportation Companies
J.B. Hunt Transport Services, Inc.’s JBHT second-quarter 2023 EPS of $1.81 missed the Zacks Consensus Estimate of $1.97 and declined 25.2% year over year.
JBHT’s total operating revenues of $3,132.6 million also lagged the Zacks Consensus Estimate of $3,347.5 million and fell 18.4% year over year. The downfall was due to a decline in revenue per load of 24% in Integrated Capacity Solutions, 13% in Intermodal, 21% in Truckload and a 4% decline in productivity in Dedicated Capacity Solutions on the back of changes in customer rate, freight mix and lower fuel surcharge revenue.
Total operating revenues, excluding fuel surcharges, decreased 14% year over year.
Delta Air Lines DAL reported better-than-expected revenues and EPS, driven by strong air-travel demand. DAL’s second-quarter 2023 EPS (excluding 16 cents from non-recurring items) of $2.68 comfortably beat the Zacks Consensus Estimate of $2.42. DAL reported EPS of $1.44 a year ago, dull compared to the current scenario, as air-travel demand was not so buoyant then.
DAL’s total revenues of $15,578 million beat the Zacks Consensus Estimate of $14,991.6 million. Total revenues increased 12.69% on a year-over-year basis, driven by higher air-travel demand.
United Airlines Holdings, Inc. (UAL) reported second-quarter 2023 EPS of $5.03, which outpaced the Zacks Consensus Estimate of $3.99 and improved more than 100% year over year.
Operating revenues of $14,178 million beat the Zacks Consensus Estimate of $13,927.1 million. UAL’s revenues increased 17.1% year over year due to upbeat air-travel demand. The year-over-year increase in the top line was driven by a 20.1% rise in passenger revenues (accounting for 91.7% of the top line) to $13,002 million. Nearly 42 million passengers traveled on UAL flights in the second quarter.
Want the latest recommendations from Zacks Investment Research? Today, you can download 7 Best Stocks for the Next 30 Days. Click to get this free report
Delta Air Lines, Inc. (DAL) : Free Stock Analysis Report
United Airlines Holdings Inc (UAL) : Free Stock Analysis Report
Southwest Airlines Co. (LUV) : Free Stock Analysis Report
J.B. Hunt Transport Services, Inc. (JBHT) : Free Stock Analysis Report
