
 Yahoo Finance
 SPAR Group, Inc.'s (NASDAQ:SGRP) Stock On An Uptrend: Could Fundamentals Be Driving The Momentum?
SPAR Group's (NASDAQ:SGRP) stock is up by a considerable 70% over the past three months. Given that stock prices are usually aligned with a company's financial performance in the long-term, we decided to study its financial indicators more closely to see if they had a hand to play in the recent price move. Particularly, we will be paying attention to SPAR Group's ROE today.
Return on equity or ROE is a key measure used to assess how efficiently a company's management is utilizing the company's capital. Put another way, it reveals the company's success at turning shareholder investments into profits.
See our latest analysis for SPAR Group
How Is ROE Calculated?
ROE can be calculated by using the formula:
Return on Equity = Net Profit (from continuing operations) ÷ Shareholders' Equity
So, based on the above formula, the ROE for SPAR Group is:
12% = US$4.8m ÷ US$40m (Based on the trailing twelve months to December 2023).
The 'return' is the income the business earned over the last year. That means that for every $1 worth of shareholders' equity, the company generated $0.12 in profit.
Why Is ROE Important For Earnings Growth?
Thus far, we have learned that ROE measures how efficiently a company is generating its profits. We now need to evaluate how much profit the company reinvests or "retains" for future growth which then gives us an idea about the growth potential of the company. Assuming everything else remains unchanged, the higher the ROE and profit retention, the higher the growth rate of a company compared to companies that don't necessarily bear these characteristics.
A Side By Side comparison of SPAR Group's Earnings Growth And 12% ROE
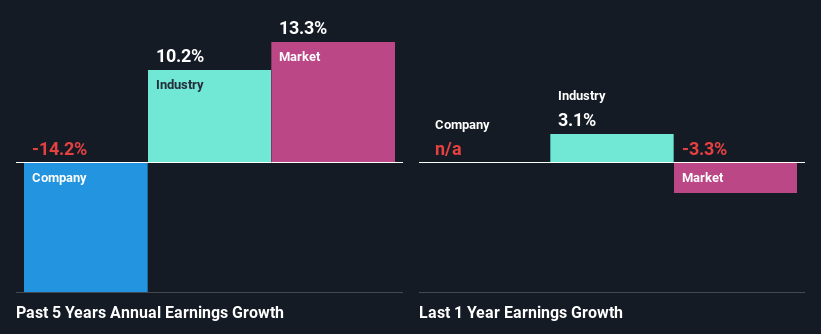
At first glance, SPAR Group seems to have a decent ROE. Even when compared to the industry average of 14% the company's ROE looks quite decent. For this reason, SPAR Group's five year net income decline of 14% raises the question as to why the decent ROE didn't translate into growth. We reckon that there could be some other factors at play here that are preventing the company's growth. These include low earnings retention or poor allocation of capital.
However, when we compared SPAR Group's growth with the industry we found that while the company's earnings have been shrinking, the industry has seen an earnings growth of 10% in the same period. This is quite worrisome.
Earnings growth is an important metric to consider when valuing a stock. What investors need to determine next is if the expected earnings growth, or the lack of it, is already built into the share price. Doing so will help them establish if the stock's future looks promising or ominous. One good indicator of expected earnings growth is the P/E ratio which determines the price the market is willing to pay for a stock based on its earnings prospects. So, you may want to check if SPAR Group is trading on a high P/E or a low P/E, relative to its industry.
Is SPAR Group Using Its Retained Earnings Effectively?
SPAR Group doesn't pay any regular dividends, meaning that the company is keeping all of its profits, which makes us wonder why it is retaining its earnings if it can't use them to grow its business. It looks like there might be some other reasons to explain the lack in that respect. For example, the business could be in decline.
Summary
In total, it does look like SPAR Group has some positive aspects to its business. However, given the high ROE and high profit retention, we would expect the company to be delivering strong earnings growth, but that isn't the case here. This suggests that there might be some external threat to the business, that's hampering its growth. Moreover, after studying current analyst estimates, we discovered that the company's earnings are expected to continue to shrink in the future. Are these analysts expectations based on the broad expectations for the industry, or on the company's fundamentals? Click here to be taken to our analyst's forecasts page for the company.
Have feedback on this article? Concerned about the content? Get in touch with us directly. Alternatively, email editorial-team (at) simplywallst.com.
This article by Simply Wall St is general in nature. We provide commentary based on historical data and analyst forecasts only using an unbiased methodology and our articles are not intended to be financial advice. It does not constitute a recommendation to buy or sell any stock, and does not take account of your objectives, or your financial situation. We aim to bring you long-term focused analysis driven by fundamental data. Note that our analysis may not factor in the latest price-sensitive company announcements or qualitative material. Simply Wall St has no position in any stocks mentioned.
