
 Yahoo Finance
 Spectris plc (LON:SXS): Financial Strength Analysis

Mid-caps stocks, like Spectris plc (LON:SXS) with a market capitalization of UK£2.3b, aren’t the focus of most investors who prefer to direct their investments towards either large-cap or small-cap stocks. Despite this, the two other categories have lagged behind the risk-adjusted returns of commonly ignored mid-cap stocks. This article will examine SXS’s financial liquidity and debt levels to get an idea of whether the company can deal with cyclical downturns and maintain funds to accommodate strategic spending for future growth. Note that this commentary is very high-level and solely focused on financial health, so I suggest you dig deeper yourself into SXS here.
View our latest analysis for Spectris
Does SXS produce enough cash relative to debt?
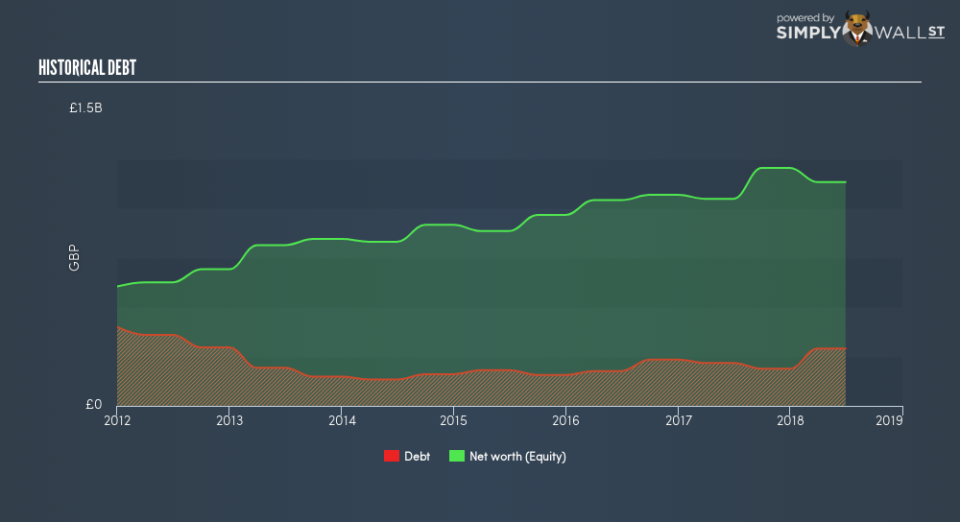
Over the past year, SXS has ramped up its debt from UK£217m to UK£290m – this includes both the current and long-term debt. With this increase in debt, SXS currently has UK£58m remaining in cash and short-term investments for investing into the business. On top of this, SXS has generated cash from operations of UK£175m during the same period of time, resulting in an operating cash to total debt ratio of 60%, indicating that SXS’s debt is appropriately covered by operating cash. This ratio can also be interpreted as a measure of efficiency as an alternative to return on assets. In SXS’s case, it is able to generate 0.6x cash from its debt capital.
Can SXS meet its short-term obligations with the cash in hand?
With current liabilities at UK£474m, it seems that the business has been able to meet these obligations given the level of current assets of UK£586m, with a current ratio of 1.24x. For Electronic companies, this ratio is within a sensible range since there is a bit of a cash buffer without leaving too much capital in a low-return environment.
Does SXS face the risk of succumbing to its debt-load?
SXS’s level of debt is appropriate relative to its total equity, at 26%. SXS is not taking on too much debt commitment, which may be constraining for future growth. We can check to see whether SXS is able to meet its debt obligations by looking at the net interest coverage ratio. A company generating earnings before interest and tax (EBIT) at least three times its net interest payments is considered financially sound. In SXS’s, case, the ratio of 40.34x suggests that interest is comfortably covered, which means that lenders may be less hesitant to lend out more funding as SXS’s high interest coverage is seen as responsible and safe practice.
Next Steps:
SXS has demonstrated its ability to generate sufficient levels of cash flow, while its debt hovers at an appropriate level. Furthermore, the company exhibits proper management of current assets and upcoming liabilities. I admit this is a fairly basic analysis for SXS’s financial health. Other important fundamentals need to be considered alongside. I suggest you continue to research Spectris to get a more holistic view of the stock by looking at:
Future Outlook: What are well-informed industry analysts predicting for SXS’s future growth? Take a look at our free research report of analyst consensus for SXS’s outlook.
Valuation: What is SXS worth today? Is the stock undervalued, even when its growth outlook is factored into its intrinsic value? The intrinsic value infographic in our free research report helps visualize whether SXS is currently mispriced by the market.
Other High-Performing Stocks: Are there other stocks that provide better prospects with proven track records? Explore our free list of these great stocks here.
To help readers see past the short term volatility of the financial market, we aim to bring you a long-term focused research analysis purely driven by fundamental data. Note that our analysis does not factor in the latest price-sensitive company announcements.
The author is an independent contributor and at the time of publication had no position in the stocks mentioned. For errors that warrant correction please contact the editor at editorial-team@simplywallst.com.
