
 Yahoo Finance
 Is Spectris plc (LON:SXS) As Strong As Its Balance Sheet Indicates?

Small-caps and large-caps are wildly popular among investors, however, mid-cap stocks, such as Spectris plc (LON:SXS), with a market capitalization of UK£3.0b, rarely draw their attention from the investing community. However, generally ignored mid-caps have historically delivered better risk-adjusted returns than the two other categories of stocks. Today we will look at SXS’s financial liquidity and debt levels, which are strong indicators for whether the company can weather economic downturns or fund strategic acquisitions for future growth. Remember this is a very top-level look that focuses exclusively on financial health, so I recommend a deeper analysis into SXS here.
Want to participate in a short research study? Help shape the future of investing tools and you could win a $250 gift card!
See our latest analysis for Spectris
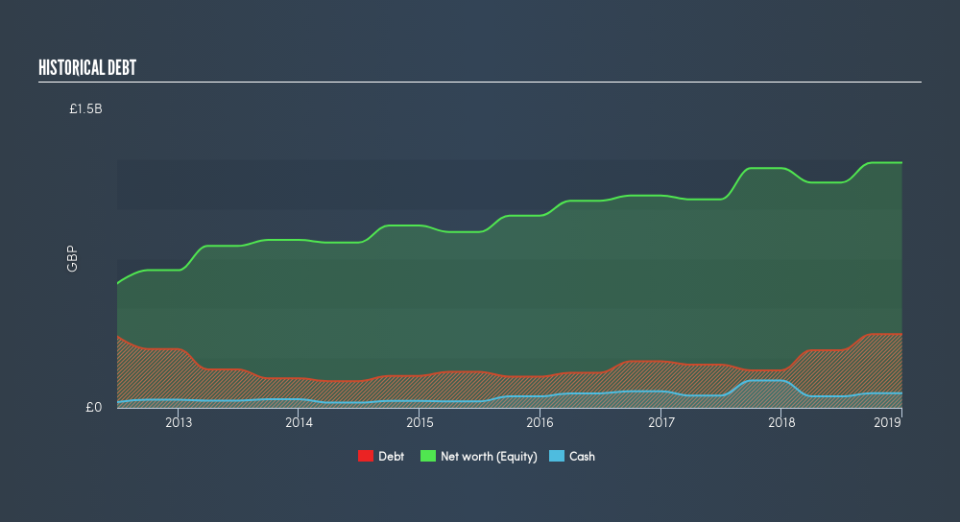
SXS’s Debt (And Cash Flows)
Over the past year, SXS has ramped up its debt from UK£189m to UK£370m , which includes long-term debt. With this growth in debt, the current cash and short-term investment levels stands at UK£73m , ready to be used for running the business. On top of this, SXS has produced UK£178m in operating cash flow in the last twelve months, leading to an operating cash to total debt ratio of 48%, meaning that SXS’s current level of operating cash is high enough to cover debt.
Can SXS pay its short-term liabilities?
At the current liabilities level of UK£424m, it seems that the business has maintained a safe level of current assets to meet its obligations, with the current ratio last standing at 1.6x. The current ratio is calculated by dividing current assets by current liabilities. For Electronic companies, this ratio is within a sensible range since there is a bit of a cash buffer without leaving too much capital in a low-return environment.
Can SXS service its debt comfortably?
With a debt-to-equity ratio of 30%, SXS's debt level may be seen as prudent. SXS is not taking on too much debt commitment, which can be restrictive and risky for equity-holders. We can test if SXS’s debt levels are sustainable by measuring interest payments against earnings of a company. Ideally, earnings before interest and tax (EBIT) should cover net interest by at least three times. For SXS, the ratio of 39.17x suggests that interest is comfortably covered, which means that debtors may be willing to loan the company more money, giving SXS ample headroom to grow its debt facilities.
Next Steps:
SXS has demonstrated its ability to generate sufficient levels of cash flow, while its debt hovers at an appropriate level. In addition to this, the company exhibits proper management of current assets and upcoming liabilities. This is only a rough assessment of financial health, and I'm sure SXS has company-specific issues impacting its capital structure decisions. I suggest you continue to research Spectris to get a more holistic view of the stock by looking at:
Future Outlook: What are well-informed industry analysts predicting for SXS’s future growth? Take a look at our free research report of analyst consensus for SXS’s outlook.
Valuation: What is SXS worth today? Is the stock undervalued, even when its growth outlook is factored into its intrinsic value? The intrinsic value infographic in our free research report helps visualize whether SXS is currently mispriced by the market.
Other High-Performing Stocks: Are there other stocks that provide better prospects with proven track records? Explore our free list of these great stocks here.
We aim to bring you long-term focused research analysis driven by fundamental data. Note that our analysis may not factor in the latest price-sensitive company announcements or qualitative material.
If you spot an error that warrants correction, please contact the editor at editorial-team@simplywallst.com. This article by Simply Wall St is general in nature. It does not constitute a recommendation to buy or sell any stock, and does not take account of your objectives, or your financial situation. Simply Wall St has no position in the stocks mentioned. Thank you for reading.
