
 Yahoo Finance
 Sports Direct boss Mike Ashley steps up business rates attack
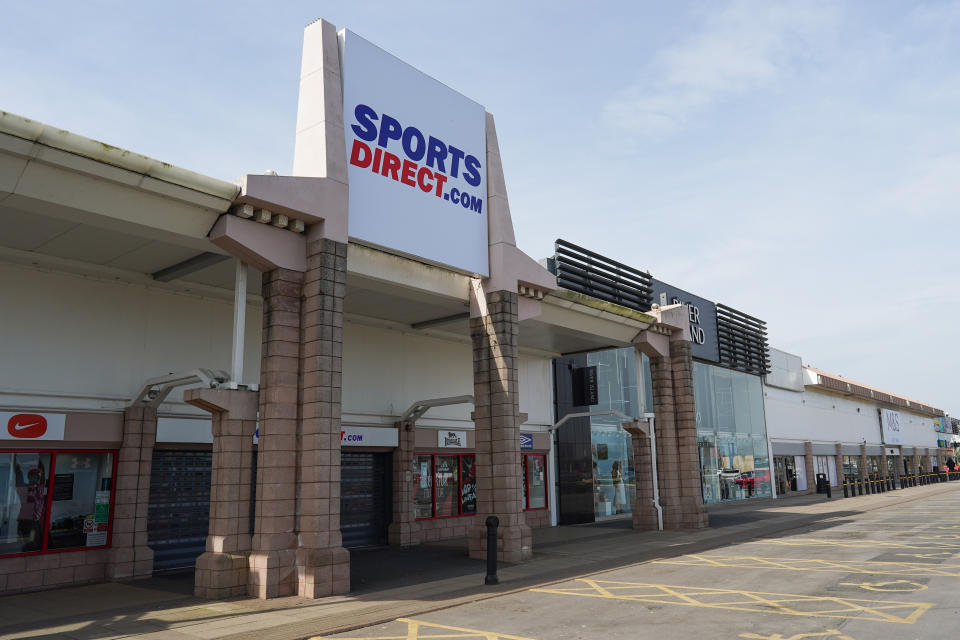
Sports Direct boss Mike Ashley has redoubled his efforts to reform business rates, in the continuation of a long-fought campaign.
In a letter to the prime minister, cosigned by Chris Wootton, CFO for Frasers Group (FRAS.L) and published by The Times, he said: “We believe that the exchequer is putting the jobs of a significant percentage of the UK workforce at risk.”
Ashley and Wootton requested a meeting or call with the prime minister. They said it could be “at any time of the day or night, to discuss the issue of business rates and potential solutions” for ten minutes.
The pair cited crippling job cuts by retailers such as John Lewis and Marks & Spencer, while warning of more problems to come for the high street. They argued that other businesses are entering insolvency due to crippling business rates, calling on the government to act now.
READ MORE: Coronavirus: How the jobs market fared this week
In February, Ashley was touting a similar story, warning that the UK high street is on life support and the time for reform “had long since passed.”
It added its name to list of 52 retailers, which included Asda, B&Q, Greggs and Ann Summers, calling for help for high street.
Earlier this month, company quarterly reports revealed that profits at Frasers Group fell 20% last year as the impact of the COVID-19 pandemic offset rising sales.
Billionaire Mike Ashley’s Frasers Group said that pre-tax profit in the 12 months to 26 April 2020 had fallen 19.9% to £143.5m ($187.6m).
The slump in profits came even as sales rose 6.9% to £3.9bn, driven by the acquisition of brands like GAME. Excluding acquisitions and currency changes, revenue fell 12.6%.
At the time, chairman David Daly said it had been “the most challenging year in the history of the company.”
The Treasury recently issued a “call for evidence,” in a move that would see a review of business rates. It also introduced a year-long holiday for retail, leisure and hospitality properties until March next year.
Like many other measures introduced since the coronavirus, there have been calls for an extension, as businesses grapple with the continued distress on the high street.
