
 Yahoo Finance
 Sports Direct International plc (LON:SPD): Does The Earnings Decline Make It An Underperformer?

Analyzing Sports Direct International plc’s (LSE:SPD) track record of past performance is a valuable exercise for investors. It enables us to reflect on whether or not the company has met expectations, which is a powerful signal for future performance. Today I will assess SPD’s recent performance announced on 29 October 2017 and compare these figures to its long-term trend and industry movements. View our latest analysis for Sports Direct International
Was SPD’s recent earnings decline indicative of a tough track record?
For the purpose of this commentary, I like to use the ‘latest twelve-month’ data, which either annualizes the most recent 6-month earnings update, or in some cases, the most recent annual report is already the latest available financial data. This technique allows me to assess different stocks on a similar basis, using new information. For Sports Direct International, its most recent earnings (trailing twelve month) is UK£163.50M, which, against the previous year’s level, has declined by -27.18%. Given that these values are somewhat myopic, I’ve computed an annualized five-year value for Sports Direct International’s earnings, which stands at UK£184.05M This doesn’t look much better, as earnings seem to have consistently been diminishing over the longer term.
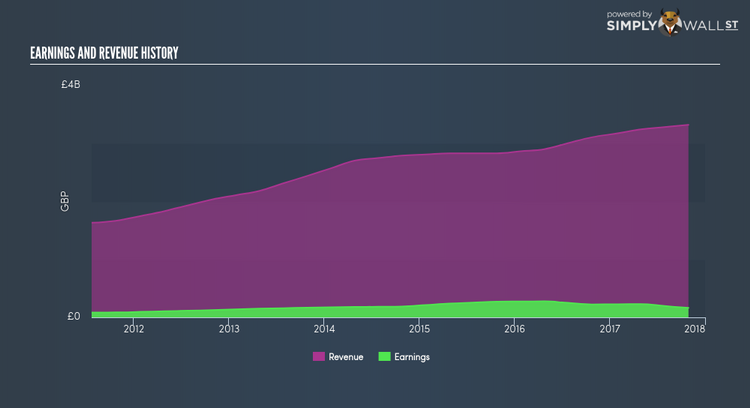
Why could this be happening? Let’s examine what’s going on with margins and whether the rest of the industry is feeling the heat. In the past few years, revenue growth has been lagging behind which suggests that Sports Direct International’s bottom line has been propelled by unmaintainable cost-reductions. Eyeballing growth from a sector-level, the UK specialty retail industry has been enduring some headwinds in the prior twelve months, leading to an average earnings drop of -4.07%. This is a major change, given that the industry has constantly been delivering a a solid growth of 16.17% in the last five years. This means whatever recent headwind the industry is enduring, it’s hitting Sports Direct International harder than its peers.
What does this mean?
Though Sports Direct International’s past data is helpful, it is only one aspect of my investment thesis. Typically companies that experience a drawn out period of reduction in earnings are undergoing some sort of reinvestment phase Although, if the entire industry is struggling to grow over time, it may be a sign of a structural change, which makes Sports Direct International and its peers a higher risk investment. I suggest you continue to research Sports Direct International to get a better picture of the stock by looking at:
Future Outlook: What are well-informed industry analysts predicting for SPD’s future growth? Take a look at our free research report of analyst consensus for SPD’s outlook.
Financial Health: Is SPD’s operations financially sustainable? Balance sheets can be hard to analyze, which is why we’ve done it for you. Check out our financial health checks here.
Other High-Performing Stocks: Are there other stocks that provide better prospects with proven track records? Explore our free list of these great stocks here.
NB: Figures in this article are calculated using data from the trailing twelve months from 29 October 2017. This may not be consistent with full year annual report figures.
To help readers see pass the short term volatility of the financial market, we aim to bring you a long-term focused research analysis purely driven by fundamental data. Note that our analysis does not factor in the latest price sensitive company announcements.
The author is an independent contributor and at the time of publication had no position in the stocks mentioned.
