
 Yahoo Finance
 SS&C Technologies Holdings Inc's Dividend Analysis
Exploring the Dividend Performance and Sustainability of SS&C Technologies Holdings Inc (NASDAQ:SSNC)
SS&C Technologies Holdings Inc (NASDAQ:SSNC) recently announced a dividend of $0.24 per share, payable on 2024-06-17, with the ex-dividend date set for 2024-06-03. As investors look forward to this upcoming payment, the spotlight also shines on the company's dividend history, yield, and growth rates. Using the data from GuruFocus, let's look into SS&C Technologies Holdings Inc's dividend performance and assess its sustainability.
What Does SS&C Technologies Holdings Inc Do?
This Powerful Chart Made Peter Lynch 29% A Year For 13 Years
How to calculate the intrinsic value of a stock?
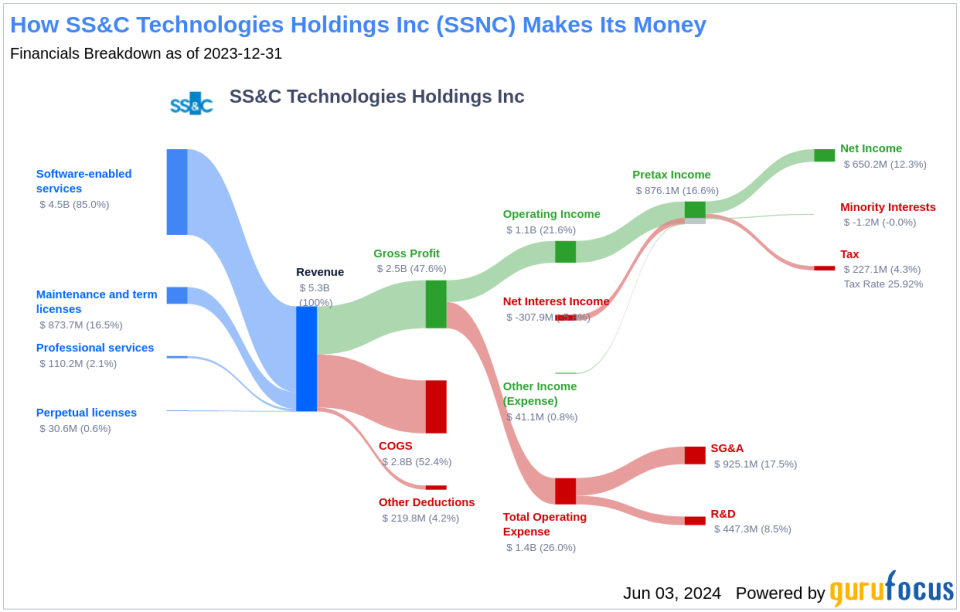
SS&C Technologies provides software products and software-enabled services to a variety of customers primarily in financial services but also healthcare firms. SS&C GlobeOp provides fund administration services to alternative and traditional asset managers. In addition, SS&C provides portfolio accounting, portfolio management, trading, banking/lending, and other software to asset managers, banks, and financial advisors. SS&C's purchase of Intralinks makes it a leading player in Virtual Data Room solutions. With its 2018 purchase of DST Systems, SS&C gained a foothold in the healthcare industry with pharmacy health management solutions and medical claim administration services. In 2022, SS&C completed the acquisition of Blue Prism.
A Glimpse at SS&C Technologies Holdings Inc's Dividend History
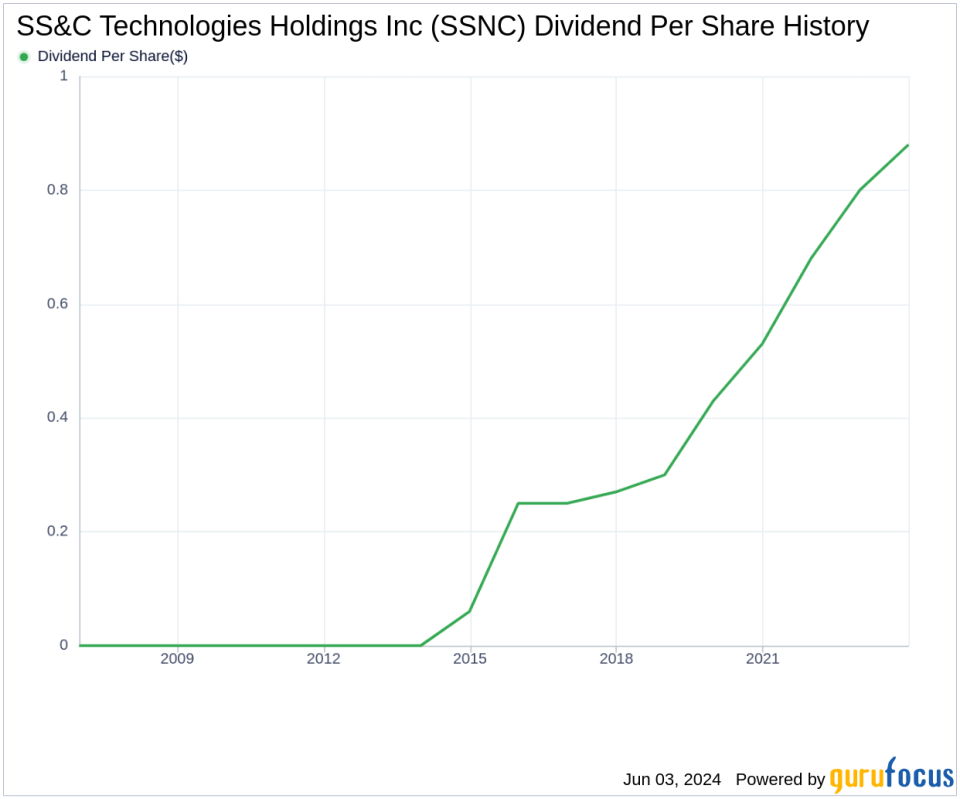
SS&C Technologies Holdings Inc has maintained a consistent dividend payment record since 2014. Dividends are currently distributed on a quarterly basis. SS&C Technologies Holdings Inc has increased its dividend each year since 2014. The stock is thus listed as a dividend achiever, an honor that is given to companies that have increased their dividend each year for at least the past 10 years.
Below is a chart showing annual Dividends Per Share for tracking historical trends.
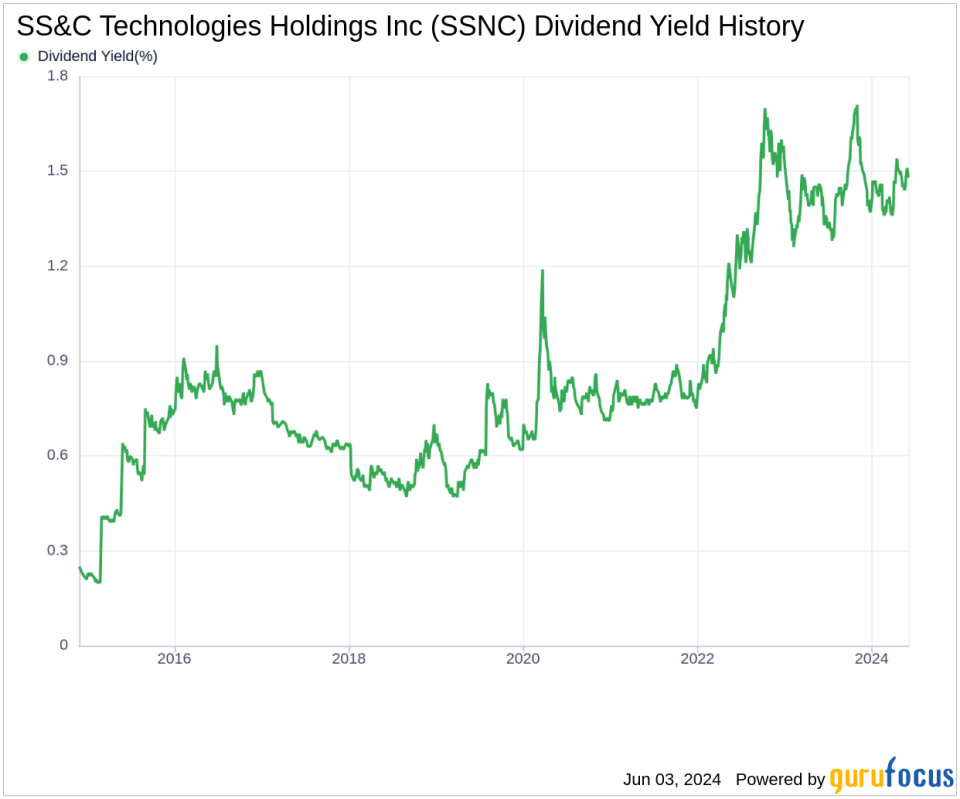
Breaking Down SS&C Technologies Holdings Inc's Dividend Yield and Growth
As of today, SS&C Technologies Holdings Inc currently has a 12-month trailing dividend yield of 1.48% and a 12-month forward dividend yield of 1.55%. This suggests an expectation of increase dividend payments over the next 12 months.
Over the past three years, SS&C Technologies Holdings Inc's annual dividend growth rate was 18.40%. Extended to a five-year horizon, this rate increased to 24.00% per year.
Based on SS&C Technologies Holdings Inc's dividend yield and five-year growth rate, the 5-year yield on cost of SS&C Technologies Holdings Inc stock as of today is approximately 4.34%.
The Sustainability Question: Payout Ratio and Profitability
To assess the sustainability of the dividend, one needs to evaluate the company's payout ratio. The dividend payout ratio provides insights into the portion of earnings the company distributes as dividends. A lower ratio suggests that the company retains a significant part of its earnings, thereby ensuring the availability of funds for future growth and unexpected downturns. As of 2024-03-31, SS&C Technologies Holdings Inc's dividend payout ratio is 0.19.
SS&C Technologies Holdings Inc's profitability rank, offers an understanding of the company's earnings prowess relative to its peers. GuruFocus ranks SS&C Technologies Holdings Inc's profitability 9 out of 10 as of 2024-03-31, suggesting good profitability prospects. The company has reported positive net income for each of year over the past decade, further solidifying its high profitability.
Growth Metrics: The Future Outlook
To ensure the sustainability of dividends, a company must have robust growth metrics. SS&C Technologies Holdings Inc's growth rank of 9 out of 10 suggests that the company's growth trajectory is good relative to its competitors.
Revenue is the lifeblood of any company, and SS&C Technologies Holdings Inc's revenue per share, combined with the 3-year revenue growth rate, indicates a strong revenue model. SS&C Technologies Holdings Inc's revenue has increased by approximately 7.30% per year on average, a rate that underperforms than approximately 54.76% of global competitors.
The company's 3-year EPS growth rate showcases its capability to grow its earnings, a critical component for sustaining dividends in the long run. During the past three years, SS&C Technologies Holdings Inc's earnings increased by approximately 25.00% per year on average, a rate that underperforms than approximately 30.09% of global competitors.
Lastly, the company's 5-year EBITDA growth rate of 31.60%, which underperforms than approximately 16.79% of global competitors.
Conclusion: Dividend Sustainability and Growth Prospects
SS&C Technologies Holdings Inc's dividend payments, growth rates, payout ratio, and profitability suggest a robust framework for future dividend sustainability. While some growth metrics show underperformance relative to global competitors, the company's strong profitability and consistent dividend increases highlight its potential as a reliable dividend-paying stock. Investors should keep an eye on these factors when considering SS&C Technologies Holdings Inc for their portfolios.
GuruFocus Premium users can screen for high-dividend yield stocks using the High Dividend Yield Screener.
This article, generated by GuruFocus, is designed to provide general insights and is not tailored financial advice. Our commentary is rooted in historical data and analyst projections, utilizing an impartial methodology, and is not intended to serve as specific investment guidance. It does not formulate a recommendation to purchase or divest any stock and does not consider individual investment objectives or financial circumstances. Our objective is to deliver long-term, fundamental data-driven analysis. Be aware that our analysis might not incorporate the most recent, price-sensitive company announcements or qualitative information. GuruFocus holds no position in the stocks mentioned herein.
This article first appeared on GuruFocus.
