
 Yahoo Finance
 How St. Modwen Properties PLC's (LON:SMP) Earnings Growth Stacks Up Against The Industry

Want to participate in a short research study? Help shape the future of investing tools and you could win a $250 gift card!
Measuring St. Modwen Properties PLC's (LON:SMP) track record of past performance is an insightful exercise for investors. It enables us to reflect on whether the company has met or exceed expectations, which is a powerful signal for future performance. Below, I will assess SMP's recent performance announced on 30 November 2018 and compare these figures to its historical trend and industry movements.
Check out our latest analysis for St. Modwen Properties
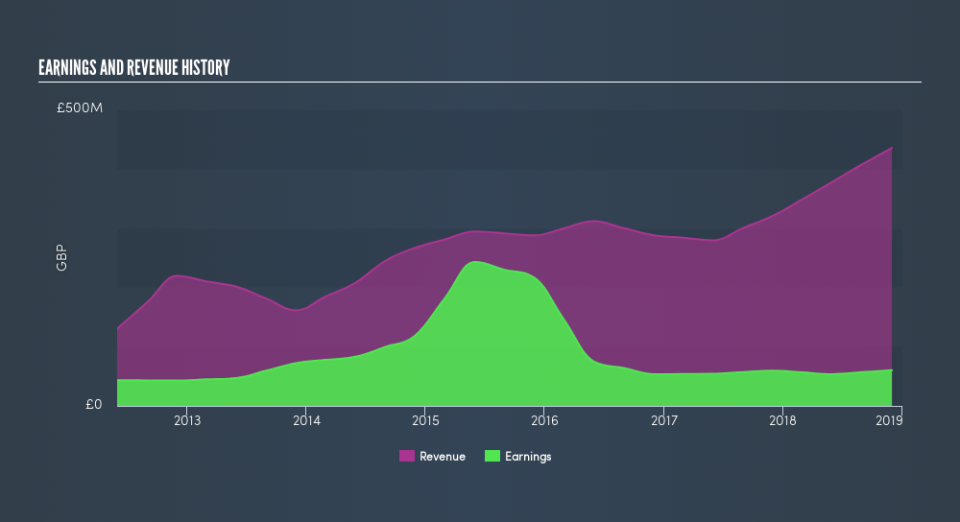
Did SMP's recent performance beat its trend and industry?
SMP's trailing twelve-month earnings (from 30 November 2018) of UK£60m has increased by 1.0% compared to the previous year.
Furthermore, this one-year growth rate has exceeded its 5-year annual growth average of -18%, indicating the rate at which SMP is growing has accelerated. What's enabled this growth? Well, let’s take a look at if it is solely a result of industry tailwinds, or if St. Modwen Properties has experienced some company-specific growth.
In terms of returns from investment, St. Modwen Properties has fallen short of achieving a 20% return on equity (ROE), recording 5.8% instead. Furthermore, its return on assets (ROA) of 5.1% is below the GB Real Estate industry of 7.0%, indicating St. Modwen Properties's are utilized less efficiently. However, its return on capital (ROC), which also accounts for St. Modwen Properties’s debt level, has increased over the past 3 years from 4.3% to 5.6%. This correlates with a decrease in debt holding, with debt-to-equity ratio declining from 58% to 30% over the past 5 years.
What does this mean?
St. Modwen Properties's track record can be a valuable insight into its earnings performance, but it certainly doesn't tell the whole story. Recent positive growth doesn’t necessarily mean it’s onwards and upwards for the company. I suggest you continue to research St. Modwen Properties to get a better picture of the stock by looking at:
Future Outlook: What are well-informed industry analysts predicting for SMP’s future growth? Take a look at our free research report of analyst consensus for SMP’s outlook.
Financial Health: Are SMP’s operations financially sustainable? Balance sheets can be hard to analyze, which is why we’ve done it for you. Check out our financial health checks here.
Other High-Performing Stocks: Are there other stocks that provide better prospects with proven track records? Explore our free list of these great stocks here.
NB: Figures in this article are calculated using data from the trailing twelve months from 30 November 2018. This may not be consistent with full year annual report figures.
We aim to bring you long-term focused research analysis driven by fundamental data. Note that our analysis may not factor in the latest price-sensitive company announcements or qualitative material.
If you spot an error that warrants correction, please contact the editor at editorial-team@simplywallst.com. This article by Simply Wall St is general in nature. It does not constitute a recommendation to buy or sell any stock, and does not take account of your objectives, or your financial situation. Simply Wall St has no position in the stocks mentioned. Thank you for reading.
