
 Yahoo Finance
 How Is STAAR Surgical's (NASDAQ:STAA) CEO Paid Relative To Peers?

Caren Mason has been the CEO of STAAR Surgical Company (NASDAQ:STAA) since 2015, and this article will examine the executive's compensation with respect to the overall performance of the company. This analysis will also look to assess whether the CEO is appropriately paid, considering recent earnings growth and investor returns for STAAR Surgical.
See our latest analysis for STAAR Surgical
Comparing STAAR Surgical Company's CEO Compensation With the industry
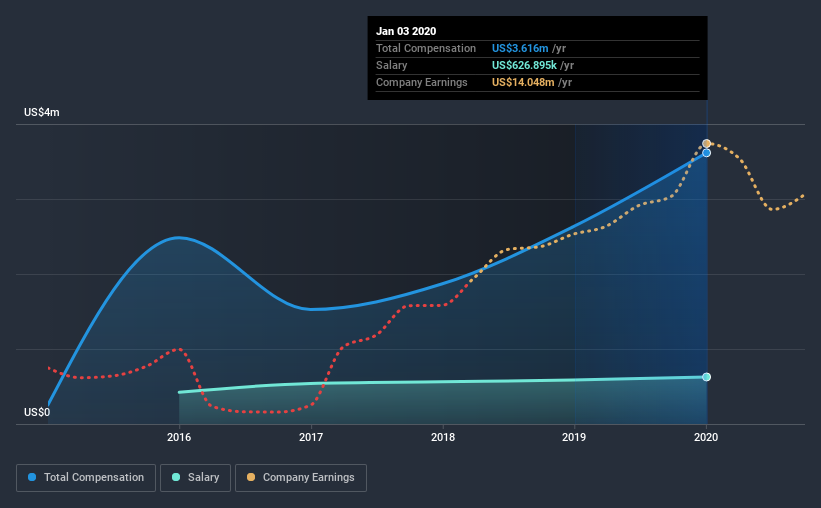
According to our data, STAAR Surgical Company has a market capitalization of US$3.7b, and paid its CEO total annual compensation worth US$3.6m over the year to January 2020. That's a notable increase of 38% on last year. While this analysis focuses on total compensation, it's worth acknowledging that the salary portion is lower, valued at US$627k.
On comparing similar companies from the same industry with market caps ranging from US$2.0b to US$6.4b, we found that the median CEO total compensation was US$5.6m. This suggests that Caren Mason is paid below the industry median. What's more, Caren Mason holds US$3.5m worth of shares in the company in their own name, indicating that they have a lot of skin in the game.
Component | 2020 | 2018 | Proportion (2020) |
Salary | US$627k | US$585k | 17% |
Other | US$3.0m | US$2.0m | 83% |
Total Compensation | US$3.6m | US$2.6m | 100% |
Speaking on an industry level, nearly 20% of total compensation represents salary, while the remainder of 80% is other remuneration. STAAR Surgical sets aside a smaller share of compensation for salary, in comparison to the overall industry. If non-salary compensation dominates total pay, it's an indicator that the executive's salary is tied to company performance.
STAAR Surgical Company's Growth
Over the past three years, STAAR Surgical Company has seen its earnings per share (EPS) grow by 70% per year. It achieved revenue growth of 9.4% over the last year.
Overall this is a positive result for shareholders, showing that the company has improved in recent years. It's nice to see revenue heading northwards, as this is consistent with healthy business conditions. Moving away from current form for a second, it could be important to check this free visual depiction of what analysts expect for the future.
Has STAAR Surgical Company Been A Good Investment?
Boasting a total shareholder return of 423% over three years, STAAR Surgical Company has done well by shareholders. As a result, some may believe the CEO should be paid more than is normal for companies of similar size.
To Conclude...
As we touched on above, STAAR Surgical Company is currently paying its CEO below the median pay for CEOs of companies belonging to the same industry and with similar market capitalizations. Since EPS growth is heading in a positive direction; many would agree with our assessment that the pay is modest. Given the strong history of shareholder returns, the shareholders are probably very happy with Caren's performance.
While it is important to pay attention to CEO remuneration, investors should also consider other elements of the business. That's why we did some digging and identified 3 warning signs for STAAR Surgical that investors should think about before committing capital to this stock.
Arguably, business quality is much more important than CEO compensation levels. So check out this free list of interesting companies that have HIGH return on equity and low debt.
This article by Simply Wall St is general in nature. It does not constitute a recommendation to buy or sell any stock, and does not take account of your objectives, or your financial situation. We aim to bring you long-term focused analysis driven by fundamental data. Note that our analysis may not factor in the latest price-sensitive company announcements or qualitative material. Simply Wall St has no position in any stocks mentioned.
Have feedback on this article? Concerned about the content? Get in touch with us directly. Alternatively, email editorial-team@simplywallst.com.
