
 Yahoo Finance
 Stella-Jones Inc.'s (TSE:SJ) Stock's On An Uptrend: Are Strong Financials Guiding The Market?

Most readers would already be aware that Stella-Jones' (TSE:SJ) stock increased significantly by 11% over the past three months. Given the company's impressive performance, we decided to study its financial indicators more closely as a company's financial health over the long-term usually dictates market outcomes. In this article, we decided to focus on Stella-Jones' ROE.
ROE or return on equity is a useful tool to assess how effectively a company can generate returns on the investment it received from its shareholders. In other words, it is a profitability ratio which measures the rate of return on the capital provided by the company's shareholders.
View our latest analysis for Stella-Jones
How Is ROE Calculated?
ROE can be calculated by using the formula:
Return on Equity = Net Profit (from continuing operations) ÷ Shareholders' Equity
So, based on the above formula, the ROE for Stella-Jones is:
12% = CA$162m ÷ CA$1.4b (Based on the trailing twelve months to March 2020).
The 'return' is the yearly profit. Another way to think of that is that for every CA$1 worth of equity, the company was able to earn CA$0.12 in profit.
Why Is ROE Important For Earnings Growth?
So far, we've learnt that ROE is a measure of a company's profitability. Depending on how much of these profits the company reinvests or "retains", and how effectively it does so, we are then able to assess a company’s earnings growth potential. Assuming everything else remains unchanged, the higher the ROE and profit retention, the higher the growth rate of a company compared to companies that don't necessarily bear these characteristics.
A Side By Side comparison of Stella-Jones' Earnings Growth And 12% ROE
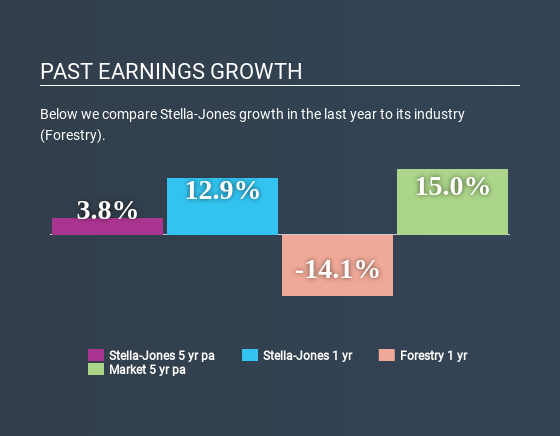
At first glance, Stella-Jones seems to have a decent ROE. Further, the company's ROE compares quite favorably to the industry average of 9.1%. Despite this, Stella-Jones' five year net income growth was quite low averaging at only 3.8%. That's a bit unexpected from a company which has such a high rate of return. Such a scenario is likely to take place when a company pays out a huge portion of its earnings as dividends, or is faced with competitive pressures.
Next, on comparing with the industry net income growth, we found that the growth figure reported by Stella-Jones compares quite favourably to the industry average, which shows a decline of 2.6% in the same period.
The basis for attaching value to a company is, to a great extent, tied to its earnings growth. The investor should try to establish if the expected growth or decline in earnings, whichever the case may be, is priced in. Doing so will help them establish if the stock's future looks promising or ominous. What is SJ worth today? The intrinsic value infographic in our free research report helps visualize whether SJ is currently mispriced by the market.
Is Stella-Jones Efficiently Re-investing Its Profits?
A low three-year median payout ratio of 22% (implying that the company retains the remaining 78% of its income) suggests that Stella-Jones is retaining most of its profits. This should be reflected in its earnings growth number, but that's not the case. So there could be some other explanation in that regard. For instance, the company's business may be deteriorating.
Moreover, Stella-Jones has been paying dividends for at least ten years or more suggesting that management must have perceived that the shareholders prefer dividends over earnings growth.
Summary
In total, we are pretty happy with Stella-Jones' performance. Specifically, we like that the company is reinvesting a huge chunk of its profits at a high rate of return. This of course has caused the company to see substantial growth in its earnings. That being so, the latest analyst forecasts show that the company will continue to see an expansion in its earnings. Are these analysts expectations based on the broad expectations for the industry, or on the company's fundamentals? Click here to be taken to our analyst's forecasts page for the company.
This article by Simply Wall St is general in nature. It does not constitute a recommendation to buy or sell any stock, and does not take account of your objectives, or your financial situation. We aim to bring you long-term focused analysis driven by fundamental data. Note that our analysis may not factor in the latest price-sensitive company announcements or qualitative material. Simply Wall St has no position in any stocks mentioned.
Have feedback on this article? Concerned about the content? Get in touch with us directly. Alternatively, email editorial-team@simplywallst.com.
