
 Yahoo Finance
 Steppe Cement (LON:STCM) Is Doing The Right Things To Multiply Its Share Price
To find a multi-bagger stock, what are the underlying trends we should look for in a business? One common approach is to try and find a company with returns on capital employed (ROCE) that are increasing, in conjunction with a growing amount of capital employed. Ultimately, this demonstrates that it's a business that is reinvesting profits at increasing rates of return. So when we looked at Steppe Cement (LON:STCM) and its trend of ROCE, we really liked what we saw.
Understanding Return On Capital Employed (ROCE)
For those who don't know, ROCE is a measure of a company's yearly pre-tax profit (its return), relative to the capital employed in the business. The formula for this calculation on Steppe Cement is:
Return on Capital Employed = Earnings Before Interest and Tax (EBIT) ÷ (Total Assets - Current Liabilities)
0.11 = US$8.6m ÷ (US$92m - US$16m) (Based on the trailing twelve months to June 2023).
Thus, Steppe Cement has an ROCE of 11%. In absolute terms, that's a pretty normal return, and it's somewhat close to the Basic Materials industry average of 10%.
View our latest analysis for Steppe Cement
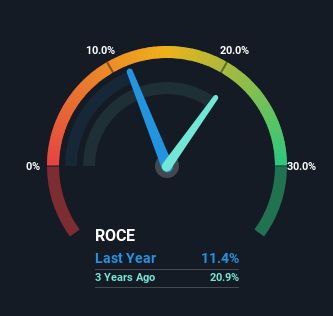
Historical performance is a great place to start when researching a stock so above you can see the gauge for Steppe Cement's ROCE against it's prior returns. If you're interested in investigating Steppe Cement's past further, check out this free graph covering Steppe Cement's past earnings, revenue and cash flow.
So How Is Steppe Cement's ROCE Trending?
Steppe Cement has not disappointed with their ROCE growth. The figures show that over the last five years, ROCE has grown 67% whilst employing roughly the same amount of capital. Basically the business is generating higher returns from the same amount of capital and that is proof that there are improvements in the company's efficiencies. On that front, things are looking good so it's worth exploring what management has said about growth plans going forward.
On a related note, the company's ratio of current liabilities to total assets has decreased to 18%, which basically reduces it's funding from the likes of short-term creditors or suppliers. So shareholders would be pleased that the growth in returns has mostly come from underlying business performance.
The Key Takeaway
To bring it all together, Steppe Cement has done well to increase the returns it's generating from its capital employed. Given the stock has declined 14% in the last five years, this could be a good investment if the valuation and other metrics are also appealing. So researching this company further and determining whether or not these trends will continue seems justified.
Like most companies, Steppe Cement does come with some risks, and we've found 5 warning signs that you should be aware of.
For those who like to invest in solid companies, check out this free list of companies with solid balance sheets and high returns on equity.
Have feedback on this article? Concerned about the content? Get in touch with us directly. Alternatively, email editorial-team (at) simplywallst.com.
This article by Simply Wall St is general in nature. We provide commentary based on historical data and analyst forecasts only using an unbiased methodology and our articles are not intended to be financial advice. It does not constitute a recommendation to buy or sell any stock, and does not take account of your objectives, or your financial situation. We aim to bring you long-term focused analysis driven by fundamental data. Note that our analysis may not factor in the latest price-sensitive company announcements or qualitative material. Simply Wall St has no position in any stocks mentioned.
