
 Yahoo Finance
 Stifel Financial's (NYSE:SF) five-year earnings growth trails the splendid shareholder returns
The most you can lose on any stock (assuming you don't use leverage) is 100% of your money. But when you pick a company that is really flourishing, you can make more than 100%. One great example is Stifel Financial Corp. (NYSE:SF) which saw its share price drive 142% higher over five years. Also pleasing for shareholders was the 12% gain in the last three months. But this move may well have been assisted by the reasonably buoyant market (up 5.5% in 90 days).
Since it's been a strong week for Stifel Financial shareholders, let's have a look at trend of the longer term fundamentals.
See our latest analysis for Stifel Financial
To paraphrase Benjamin Graham: Over the short term the market is a voting machine, but over the long term it's a weighing machine. One way to examine how market sentiment has changed over time is to look at the interaction between a company's share price and its earnings per share (EPS).
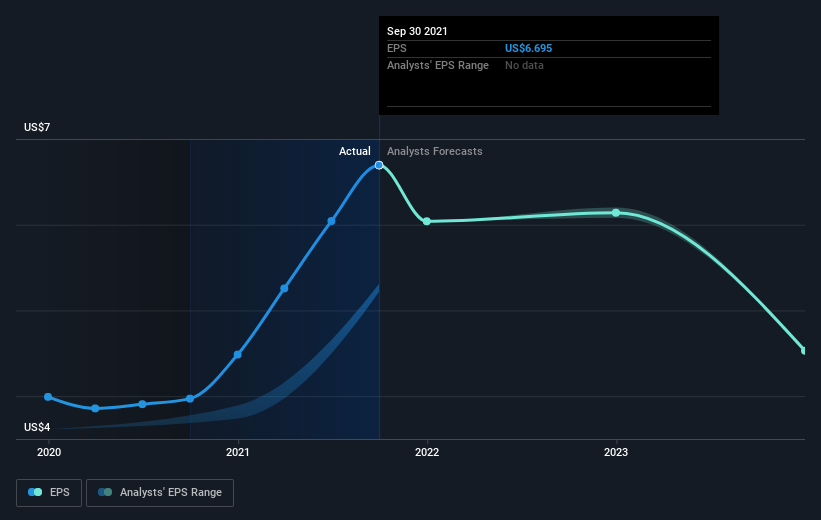
Over half a decade, Stifel Financial managed to grow its earnings per share at 61% a year. The EPS growth is more impressive than the yearly share price gain of 19% over the same period. So it seems the market isn't so enthusiastic about the stock these days. The reasonably low P/E ratio of 11.13 also suggests market apprehension.
The graphic below depicts how EPS has changed over time (unveil the exact values by clicking on the image).
We know that Stifel Financial has improved its bottom line over the last three years, but what does the future have in store? It might be well worthwhile taking a look at our free report on how its financial position has changed over time.
What About Dividends?
As well as measuring the share price return, investors should also consider the total shareholder return (TSR). Whereas the share price return only reflects the change in the share price, the TSR includes the value of dividends (assuming they were reinvested) and the benefit of any discounted capital raising or spin-off. It's fair to say that the TSR gives a more complete picture for stocks that pay a dividend. We note that for Stifel Financial the TSR over the last 5 years was 152%, which is better than the share price return mentioned above. The dividends paid by the company have thusly boosted the total shareholder return.
A Different Perspective
We're pleased to report that Stifel Financial shareholders have received a total shareholder return of 71% over one year. That's including the dividend. That's better than the annualised return of 20% over half a decade, implying that the company is doing better recently. In the best case scenario, this may hint at some real business momentum, implying that now could be a great time to delve deeper. While it is well worth considering the different impacts that market conditions can have on the share price, there are other factors that are even more important. For example, we've discovered 1 warning sign for Stifel Financial that you should be aware of before investing here.
Of course Stifel Financial may not be the best stock to buy. So you may wish to see this free collection of growth stocks.
Please note, the market returns quoted in this article reflect the market weighted average returns of stocks that currently trade on US exchanges.
This article by Simply Wall St is general in nature. We provide commentary based on historical data and analyst forecasts only using an unbiased methodology and our articles are not intended to be financial advice. It does not constitute a recommendation to buy or sell any stock, and does not take account of your objectives, or your financial situation. We aim to bring you long-term focused analysis driven by fundamental data. Note that our analysis may not factor in the latest price-sensitive company announcements or qualitative material. Simply Wall St has no position in any stocks mentioned.
Have feedback on this article? Concerned about the content? Get in touch with us directly. Alternatively, email editorial-team (at) simplywallst.com.
