
 Yahoo Finance
 Why stock market investors shouldn't fear a yield curve inversion

The bond market may be driving toward an inverted yield curve, which could be the precursor for a recession. But that doesn’t mean stock investors should be getting out of the market, UBS analysts say. In fact, historically they point out that stocks have rallied in such an environment.
An inverted yield curve happens when U.S. Treasury 2-year notes pay a higher yield than 10-year notes. Historically, a yield curve inversion has forecast an economic downturn. The yield curve inverted before the recessions of 1981, 1991, 2000 and 2008. In fact, it has predicted all nine U.S. recessions since 1955, with a lag time ranging from six months to two years.
Meanwhile, the benchmark S&P 500 (^GSPC) has rallied in each instance of curve inversion.
“As the [U.S. Treasury] curve is still flattening, we would point out that the S&P 500 has rallied an average of 15% in the 12 months before the 10-2y hits zero,”UBS strategists Keith Parker, Omar Elongbway and Neal Burk said. “S&P 500 returns have averaged 29% from the point that the curve inverts to the subsequent equity peak, which can be as early as 5 days and as late as 27 months from the inversion.”
Further, they posit that market trends suggest that the S&P is headed to 3500. The index currently sits slightly above 2700.
UBS also notes that on average recessions start 21 months after a yield curve inversion, ranging from nine months to just under three years, and drawdowns have been taken the S&P 500 23- 43% lower from the point of inversion.
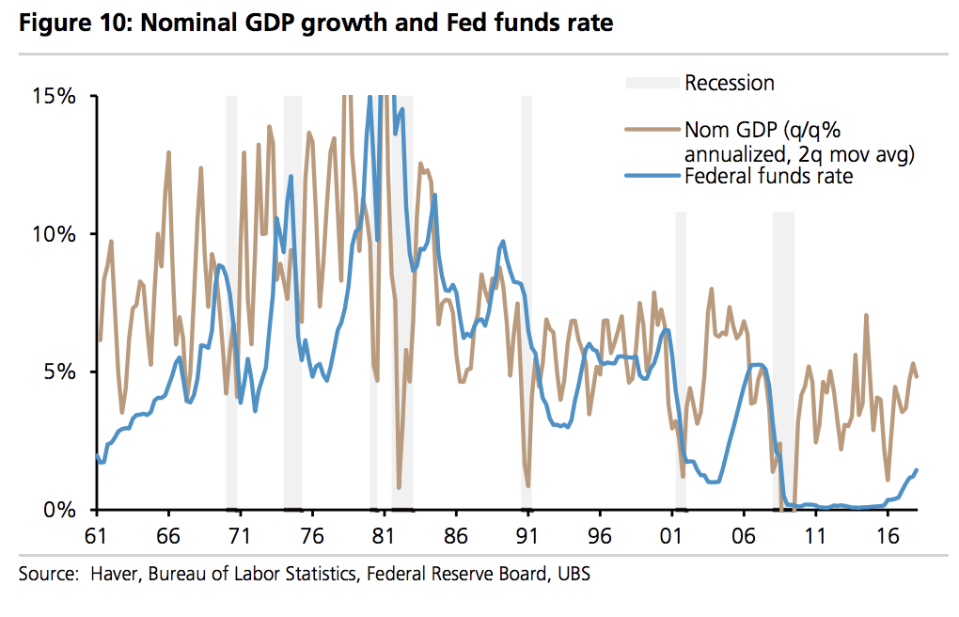
The analysts are forecasting 5% nominal growth for the United States this year and next. That is likely to forestall a downturn, as in the past each growth cycle was ended after the Federal funds rate and U.S. 10-year Treasury rate rose above the U.S. nominal growth rate.
“As the U.S. fiscal stimulus starts to fade in 2020 and the credit impulse begins to turn, a turn in the cycle could occur in 2020,” the strategists wrote. “However, we believe the level of GDP and corporate profits is likely to be substantially higher before growth slows. Thus we position for a two-year cycle.”
—
Dion Rabouin is a markets reporter for Yahoo Finance. Follow him on Twitter: @DionRabouin.
Follow Yahoo Finance on Facebook, Twitter, Instagram, and LinkedIn.
