
 Yahoo Finance
 It's A Story Of Risk Vs Reward With Malvern International Plc (LON:MLVN)
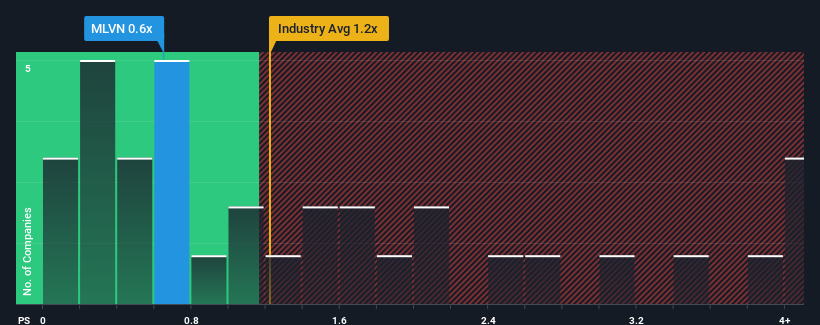
When close to half the companies operating in the Consumer Services industry in the United Kingdom have price-to-sales ratios (or "P/S") above 1.6x, you may consider Malvern International Plc (LON:MLVN) as an attractive investment with its 0.6x P/S ratio. Nonetheless, we'd need to dig a little deeper to determine if there is a rational basis for the reduced P/S.
See our latest analysis for Malvern International
What Does Malvern International's P/S Mean For Shareholders?
With revenue growth that's exceedingly strong of late, Malvern International has been doing very well. It might be that many expect the strong revenue performance to degrade substantially, which has repressed the P/S ratio. If that doesn't eventuate, then existing shareholders have reason to be quite optimistic about the future direction of the share price.
Want the full picture on earnings, revenue and cash flow for the company? Then our free report on Malvern International will help you shine a light on its historical performance.
How Is Malvern International's Revenue Growth Trending?
The only time you'd be truly comfortable seeing a P/S as low as Malvern International's is when the company's growth is on track to lag the industry.
If we review the last year of revenue growth, the company posted a terrific increase of 174%. The strong recent performance means it was also able to grow revenue by 119% in total over the last three years. Therefore, it's fair to say the revenue growth recently has been superb for the company.
Comparing that recent medium-term revenue trajectory with the industry's one-year growth forecast of 0.9% shows it's noticeably more attractive.
With this in mind, we find it intriguing that Malvern International's P/S isn't as high compared to that of its industry peers. Apparently some shareholders believe the recent performance has exceeded its limits and have been accepting significantly lower selling prices.
What We Can Learn From Malvern International's P/S?
Generally, our preference is to limit the use of the price-to-sales ratio to establishing what the market thinks about the overall health of a company.
We're very surprised to see Malvern International currently trading on a much lower than expected P/S since its recent three-year growth is higher than the wider industry forecast. When we see robust revenue growth that outpaces the industry, we presume that there are notable underlying risks to the company's future performance, which is exerting downward pressure on the P/S ratio. It appears many are indeed anticipating revenue instability, because the persistence of these recent medium-term conditions would normally provide a boost to the share price.
We don't want to rain on the parade too much, but we did also find 4 warning signs for Malvern International (2 are concerning!) that you need to be mindful of.
It's important to make sure you look for a great company, not just the first idea you come across. So if growing profitability aligns with your idea of a great company, take a peek at this free list of interesting companies with strong recent earnings growth (and a low P/E).
Have feedback on this article? Concerned about the content? Get in touch with us directly. Alternatively, email editorial-team (at) simplywallst.com.
This article by Simply Wall St is general in nature. We provide commentary based on historical data and analyst forecasts only using an unbiased methodology and our articles are not intended to be financial advice. It does not constitute a recommendation to buy or sell any stock, and does not take account of your objectives, or your financial situation. We aim to bring you long-term focused analysis driven by fundamental data. Note that our analysis may not factor in the latest price-sensitive company announcements or qualitative material. Simply Wall St has no position in any stocks mentioned.
