
 Yahoo Finance
 Ströer SE & Co. KGaA (ETR:SAX) Delivered A Better ROE Than Its Industry
While some investors are already well versed in financial metrics (hat tip), this article is for those who would like to learn about Return On Equity (ROE) and why it is important. We'll use ROE to examine Ströer SE & Co. KGaA (ETR:SAX), by way of a worked example.
Return on Equity or ROE is a test of how effectively a company is growing its value and managing investors’ money. In simpler terms, it measures the profitability of a company in relation to shareholder's equity.
View our latest analysis for Ströer SE KGaA
How To Calculate Return On Equity?
Return on equity can be calculated by using the formula:
Return on Equity = Net Profit (from continuing operations) ÷ Shareholders' Equity
So, based on the above formula, the ROE for Ströer SE KGaA is:
44% = €178m ÷ €404m (Based on the trailing twelve months to June 2022).
The 'return' is the income the business earned over the last year. That means that for every €1 worth of shareholders' equity, the company generated €0.44 in profit.
Does Ströer SE KGaA Have A Good Return On Equity?
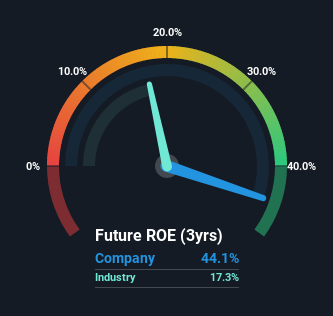
By comparing a company's ROE with its industry average, we can get a quick measure of how good it is. The limitation of this approach is that some companies are quite different from others, even within the same industry classification. As is clear from the image below, Ströer SE KGaA has a better ROE than the average (17%) in the Media industry.
That is a good sign. With that said, a high ROE doesn't always indicate high profitability. A higher proportion of debt in a company's capital structure may also result in a high ROE, where the high debt levels could be a huge risk . You can see the 2 risks we have identified for Ströer SE KGaA by visiting our risks dashboard for free on our platform here.
Why You Should Consider Debt When Looking At ROE
Virtually all companies need money to invest in the business, to grow profits. The cash for investment can come from prior year profits (retained earnings), issuing new shares, or borrowing. In the first two cases, the ROE will capture this use of capital to grow. In the latter case, the use of debt will improve the returns, but will not change the equity. That will make the ROE look better than if no debt was used.
Ströer SE KGaA's Debt And Its 44% ROE
Ströer SE KGaA does use a high amount of debt to increase returns. It has a debt to equity ratio of 2.05. Its ROE is pretty impressive but, it would have probably been lower without the use of debt. Investors should think carefully about how a company might perform if it was unable to borrow so easily, because credit markets do change over time.
Conclusion
Return on equity is a useful indicator of the ability of a business to generate profits and return them to shareholders. Companies that can achieve high returns on equity without too much debt are generally of good quality. All else being equal, a higher ROE is better.
Having said that, while ROE is a useful indicator of business quality, you'll have to look at a whole range of factors to determine the right price to buy a stock. Profit growth rates, versus the expectations reflected in the price of the stock, are a particularly important to consider. So you might want to check this FREE visualization of analyst forecasts for the company.
If you would prefer check out another company -- one with potentially superior financials -- then do not miss this free list of interesting companies, that have HIGH return on equity and low debt.
Have feedback on this article? Concerned about the content? Get in touch with us directly. Alternatively, email editorial-team (at) simplywallst.com.
This article by Simply Wall St is general in nature. We provide commentary based on historical data and analyst forecasts only using an unbiased methodology and our articles are not intended to be financial advice. It does not constitute a recommendation to buy or sell any stock, and does not take account of your objectives, or your financial situation. We aim to bring you long-term focused analysis driven by fundamental data. Note that our analysis may not factor in the latest price-sensitive company announcements or qualitative material. Simply Wall St has no position in any stocks mentioned.
Join A Paid User Research Session
You’ll receive a US$30 Amazon Gift card for 1 hour of your time while helping us build better investing tools for the individual investors like yourself. Sign up here
